Estonia’s cement production up +22.2% in 07M 2026
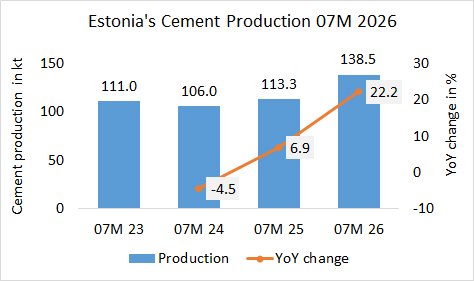
In the first 47months in 2026, Estonia’s cement production increased by +22.2% YoY to 138.5 kt, after 113.3 kt last year and 106.0 kt the year before.

In the first 47months in 2026, Estonia’s cement production increased by +22.2% YoY to 138.5 kt, after 113.3 kt last year and 106.0 kt the year before.
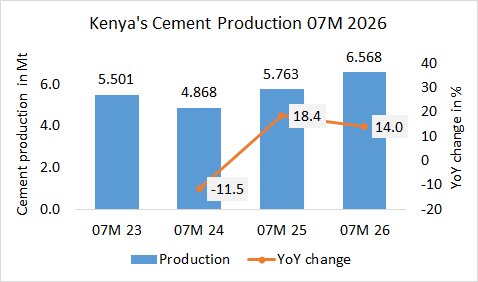
In the first 7 months in 2026, Kenya’s cement production increased by +14.0% YoY to 6.568 Mt, after 5.763 Mt in the same period last year and 4.868 Mt in the year before.
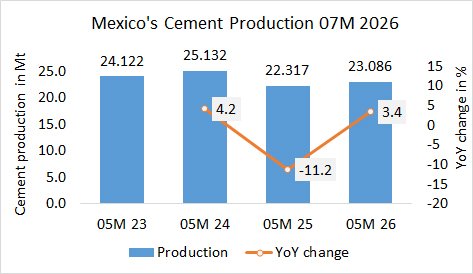
In the first 07 months in 2026, Mexico’s cement production (of integrated plants) increased by +3.4% YoY to 23.086 Mt, after 22.317 Mt in the same period last year and 25.132 Mt in the year before.
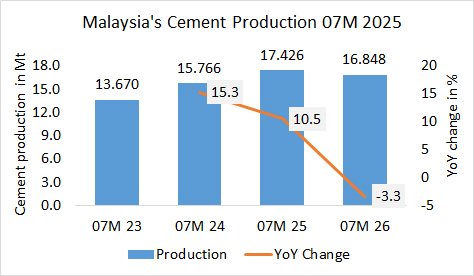
In the first 7 months in 2026, Malaysia’s cement production decreased by -3.3% YoY to 16.848 Mt, after 17.426 Mt in the same period last year and 15.766 Mt in the year before.
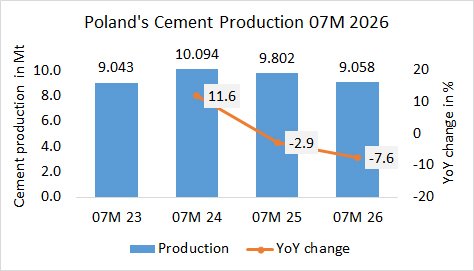
In the first 7 months in 2026, Poland’s cement production decreased by -7.6% YoY to 9.058 Mt, after 9.802 Mt in the same period last year and 10.094 Mt in the year before.
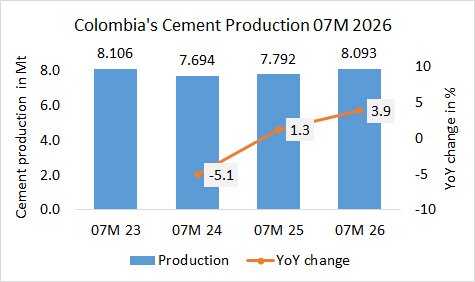
In the first 7 months in 2026, Colombia’s cement production increased by +3.9% YoY to 8.093 Mt, after 7.792 Mt in the same period last year and 7.694 Mt in the year before.
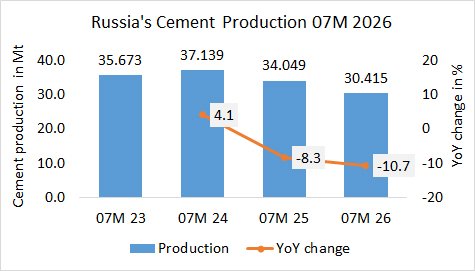
In the first 7 months, Russia’s cement production decreased by -10.7% YoY to 30.415 Mt, after 34.049 Mt same period last year and 37.139 Mt the year before.
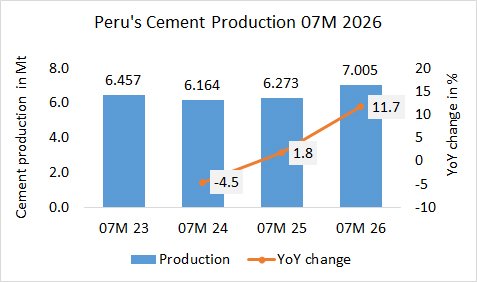
In the first 7 months in 2026, Peru’s cement production (Asocem associated producers) increased by +11.7% YoY to 7.005 Mt, after 6.273 Mt in the same period last year and 6.164 Mt in the year before.
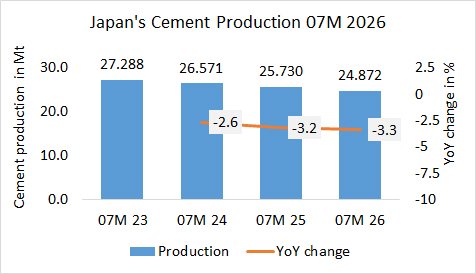
In the first 7 months in 2026, Japan’s cement production decreased by -3.3% YoY to 24.872 Mt, after 25.730 Mt in the same period last year and 26.571 Mt in the year before.
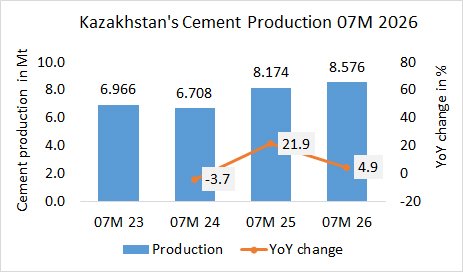
In the first 7 months in 2026, Kazakhstan’s cement production increased by +4.9% YoY to 8.576 Mt, after 8.174 Mt in the same period last year and 6.708 Mt in the year before.