Mexico’s cement production down -9.7% in 10M 2025
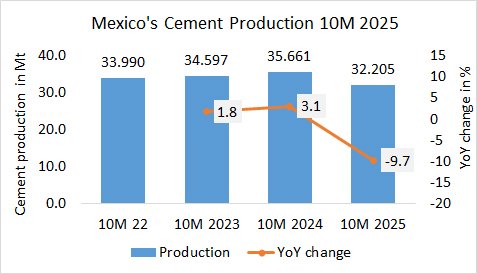
In the first 10 months in 2025, Mexico’s cement production (of integrated plants) decreased by -9.7%% to 32.205 Mt, after 35.661 Mt in the same period last year and 34.595 Mt in the year before.

In the first 10 months in 2025, Mexico’s cement production (of integrated plants) decreased by -9.7%% to 32.205 Mt, after 35.661 Mt in the same period last year and 34.595 Mt in the year before.
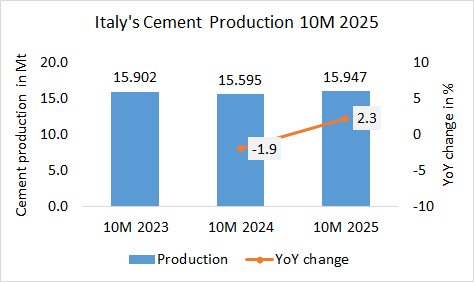
In the first 10 months in 2025, Italy’s cement production increased by +2.3% to 15.947 Mt, after 15.595 Mt in the same period last year and 15.902 Mt in the year before.

In the first 10 months in 2025, Kenya’s cement production increased by +17.8% to 8.593 Mt, after 7.294 Mt in the same period last year and 8.044 Mt in the year before.
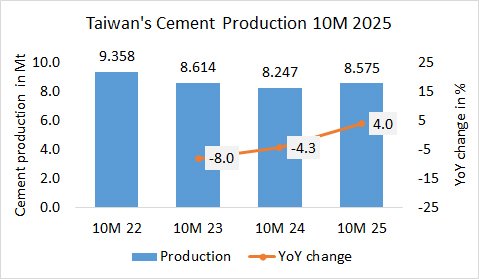
In the first 10 months in 2025, Taiwan’s cement production increased by +4.0% to 8.575 Mt, after 8.247 Mt in the same period last year and 8.614 Mt in the year before.
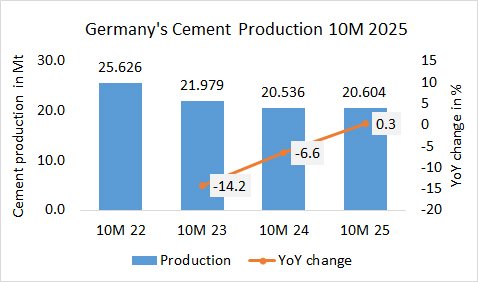
In the first 10 months in 2025, Germany’s cement production increased by +0.3% to 20.604 Mt, after 20.536 Mt in the same period last year and 21.979 Mt in the year before.
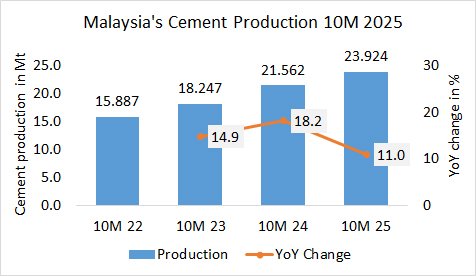
In the first 10 months in 2025, Malaysia’s cement production increased by +11.0% to 23.924 Mt, after 21.562 Mt in the same period last year and 18.247 Mt in the year before.
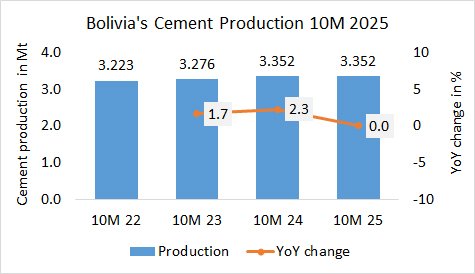
In the first 10 months in 2025, Bolivia’s cement production is stagnating with 0.0% growth and 3.352 Mt, after 3.352 Mt in the last year and 3.276 Mt in the year before.
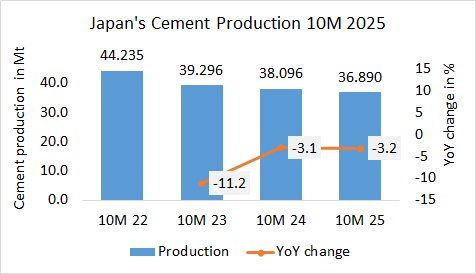
In the first 10 months in 2025, Japan’s cement production decreased by -3.2% to 36.890 Mt, after 38.096 Mt in the same period last year and 39.296 Mt in the year before.

In the first 10 months in 2025, Estonia’s cement production increased by +8.1% to 171.8 kt, after 159.0 kt in the same period last year and 170.0 kt in the year before.
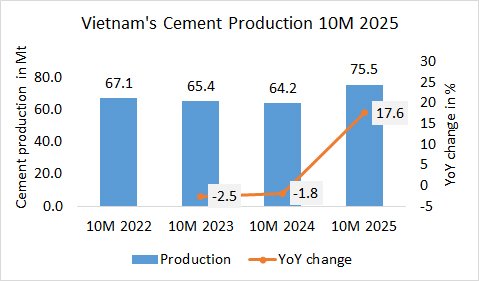
In the first 10 months of 2025, Vietnam’s cement production significantly increased by +17.6% to 75.5 Mt, after 64.2 Mt in the last year and 65.4 Mt in the year before. If clinker exports by the industry are included, than…