US Cement dispatch down -0.3% in the year 2025
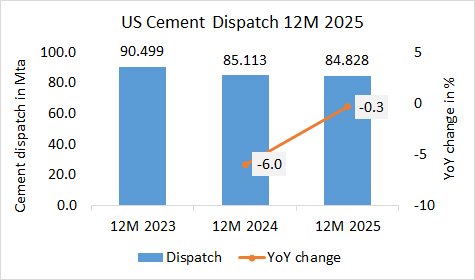
In the year 2025 the US cement dispatch (Portland, blended and masonry cement) declined by -0.3% to 84.828 Mta, after 85.113 Mta in the last year and 90.499 Mta in the year before.

In the year 2025 the US cement dispatch (Portland, blended and masonry cement) declined by -0.3% to 84.828 Mta, after 85.113 Mta in the last year and 90.499 Mta in the year before.
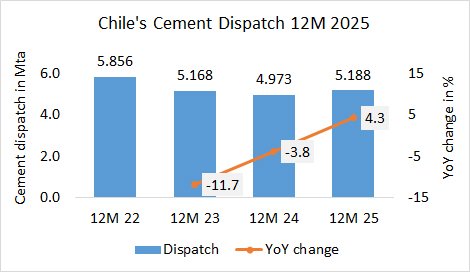
In the year 2025, Chile’s cement production increased by +4.3% to 5.188 Mta, after 4.973 Mta in 2024 and 5.168 Mta in the 2023.
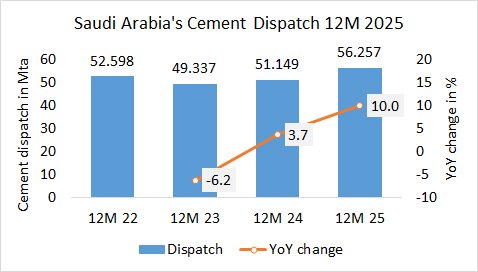
In the year 2025, Saudi Arabia’s cement dispatch (local and exports) increased by +10.0% to 56.257 Mta, after 51.149 Mta in 2024 and 49.337 Mta in the 2023.
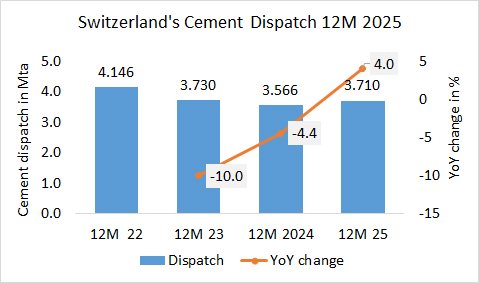
In calendar year 2025, Switzerland and Liechtenstein’s cement dispatch increased by 4.0% to 3.710 Mta, after 3.566 Mta in year 2024 and 3.730 Mta in 2023.
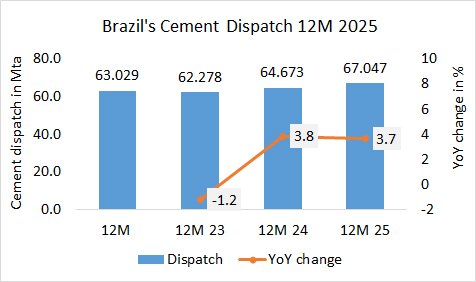
In calendar year 2025, Brazil’s cement dispatch increased by 3.7+% to 67.047 Mta, after 64.673 Mta in year 2024 and 62.278 Mta in 2023.
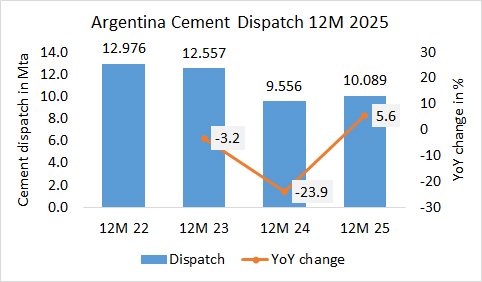
In calendar year 2025, Argentina’s cement dispatch increased by 5.6+% to 10.089 Mta, after 9.556 Mta in year 2024 and 12.557 Mta in 2023.
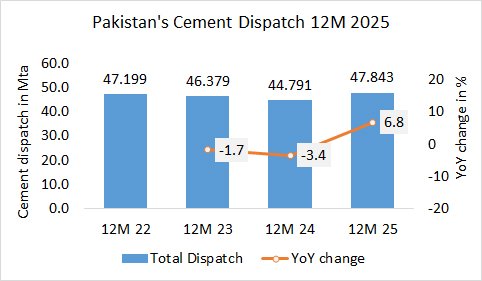
In calendar year 2025, Pakistan’s cement dispatch increased by +6.8% to 47.843 Mta, after 44.791 Mta in year 2024 and 46.379 Mta in 2023.