Taiwan’s cement production up +8.9% in 05M 2025
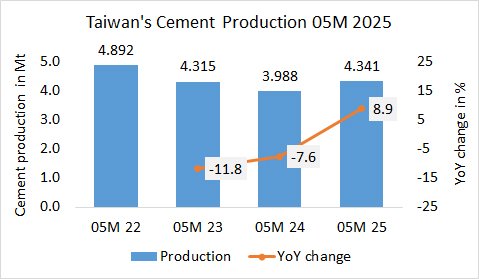
In the first 5 months in 2025, Taiwan’s cement production increased by +8.9% to 4.341 Mt, after 3.988 Mt in the same period last year and 4.315 Mt in the year before.

In the first 5 months in 2025, Taiwan’s cement production increased by +8.9% to 4.341 Mt, after 3.988 Mt in the same period last year and 4.315 Mt in the year before.
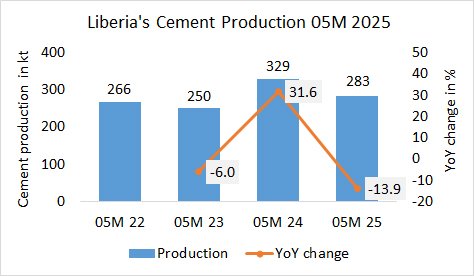
In the first 5 months in 2025, Liberia’s cement production decreased by -13.9% to 283 kt, after 329 kt in the same period last year and 250 kt in the year before.
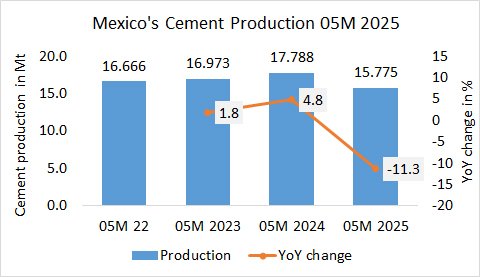
In the first 5 months in 2025, Mexico’s cement production (of integrated plants) decreased by -11.3%% to 15.775 Mt, after 17.788 Mt in the same period last year and 16.973 Mt in the year before.
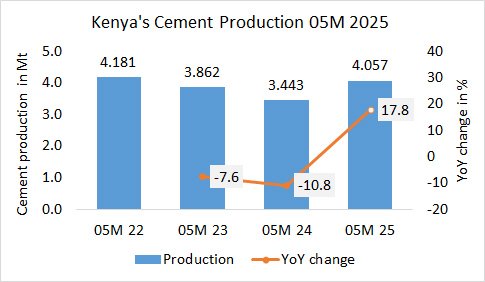
In the first 5 months in 2025, Kenya’s cement production increased by +17.8% to 4.057 Mt, after 3.443 Mt in the same period last year and 3.862 Mt in the year before.
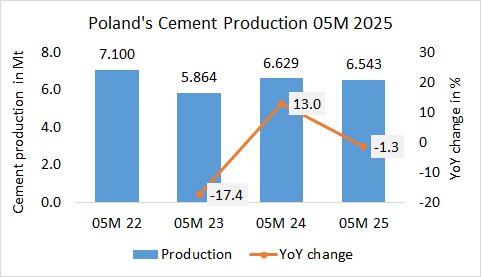
In the first 5 months in 2025, Poland’s cement production declined by -1.3% to 6.543 Mt, after 6.629 Mt in the same period last year and 5.864 Mt in the year before.
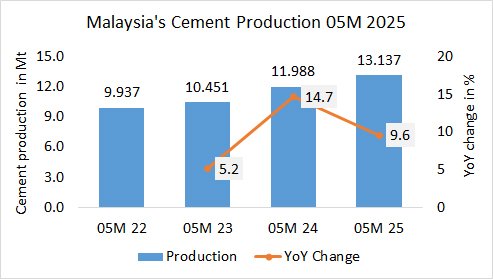
In the first 5 months in 2025, Malaysia’s cement production increased by +9.6% to 13.137 Mt, after 11.988 Mt in the same period last year and 10.451 Mt in the year before.
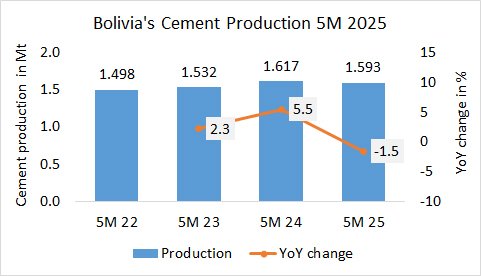
In the first 5 months in 2025, Bolivia’s cement production declined by -1.5% to 1.593 Mt, after 1.617 Mt in the last year and 1.532 Mt in the year before.
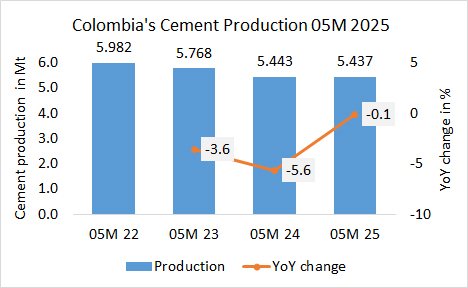
In the first 5 months in 2025, Colombia’s cement production declined by -0.1% to 5.437 Mt, after 5.443 Mt in the same period last year and 5.768 Mt in the year before.
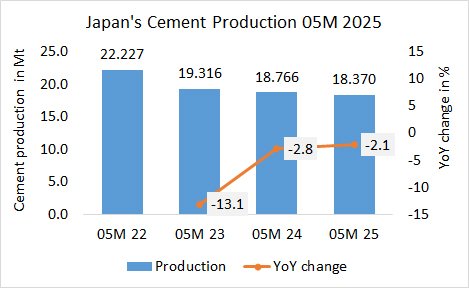
In the first 5 months in 2025, Japan’s cement production decreased only by -2.1% to 18.370 Mt, after 18.766 Mt in the same period last year and 19.316Mt in the year before.
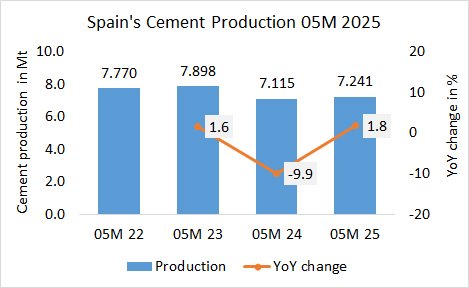
In the first 5 months in 2025, Spain’s cement production increased by +1.8% to 7.241 Mt, after 7.115 Mt in the same period last year and 7.898 Mt in the year before.