Türkiye’s cement production up +5.2% in 07M 2025
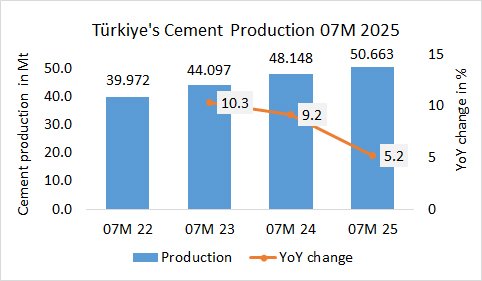
In the first 7 months 2025, Türkiye’s cement production increased by +5.2% to 50.663 Mt, after 48.148 Mt in the last year and 44.097 Mt in the year before.

In the first 7 months 2025, Türkiye’s cement production increased by +5.2% to 50.663 Mt, after 48.148 Mt in the last year and 44.097 Mt in the year before.
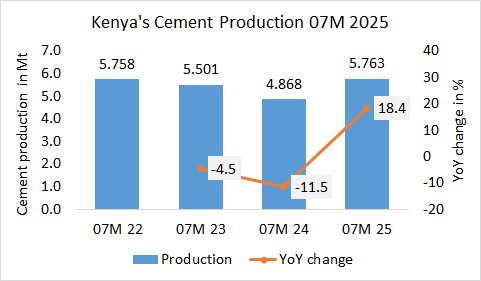
In the first 7 months in 2025, Kenya’s cement production increased by +18.4% to 5.763 Mt, after 4.868 Mt in the same period last year and 5.501 Mt in the year before.
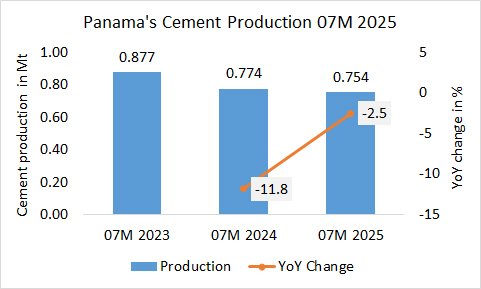
In the first 7 months in 2025, Panama’s cement production declined by -2.5% to 0.754 Mt, after 0.774 Mt in the same period last year and 0.877 Mt in the year before.
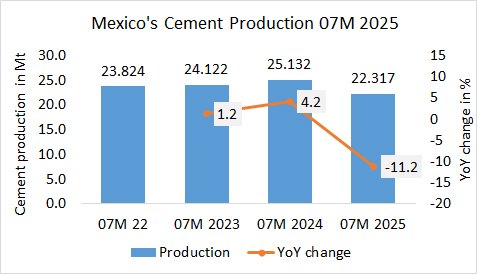
In the first 7 months in 2025, Mexico’s cement production (of integrated plants) decreased by -11.2%% to 22.317 Mt, after 25.132 Mt in the same period last year and 24.122 Mt in the year before.
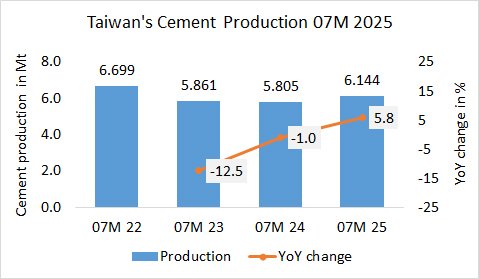
In the first 7 months in 2025, Taiwan’s cement production increased by +5.8% to 6.144 Mt, after 5.805 Mt in the same period last year and 5.861 Mt in the year before.
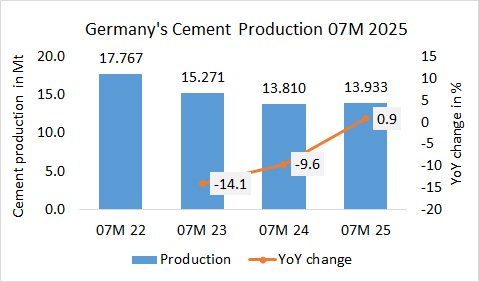
In the first 7 months in 2025, Germany’s cement production increased by +0.9% to 13.933 Mt, after 13.810 Mt in the same period last year and 15.271Mt in the year before.
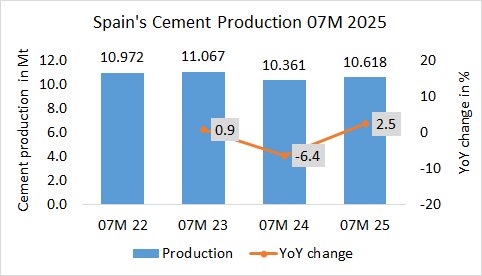
In the first 7 months in 2025, Spain’s cement production increased by +2.5% to 10.618 Mt, after 10.361 Mt in the same period last year and 11.067 Mt in the year before.
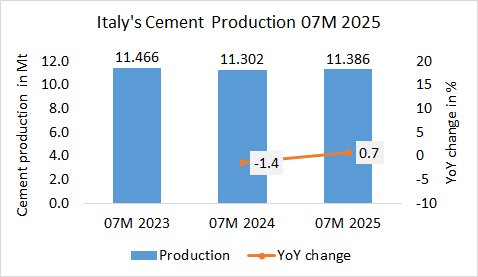
In the first 7 months in 2025, Italy’s cement production increased by +0.7% to 11.386 Mt, after 11.302 Mt in the same period last year and 11.466 Mt in the year before.
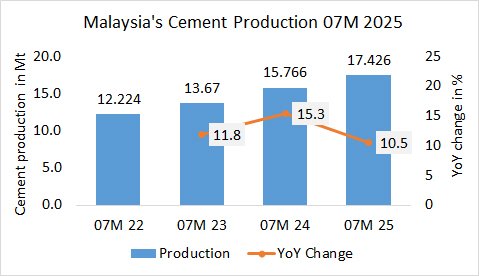
In the first 7 months in 2025, Malaysia’s cement production increased by +10.5% to 17.426 Mt, after 15.766 Mt in the same period last year and 13.670 Mt in the year before.
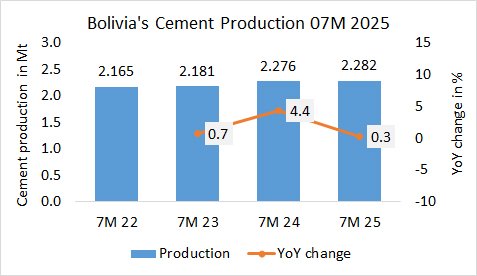
In the first 7 months in 2025, Bolivia’s cement production increased by +0.3% to 2.282 Mt, after 2.276 Mt in the last year and 2.181 Mt in the year before.