Türkiye’s cement production up +7.5% in 09M 2025
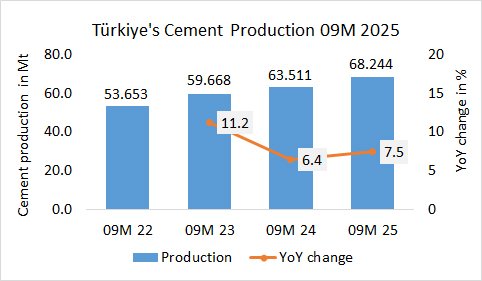
In the first 9 months 2025, Türkiye’s cement production increased by +7.5% to 68.244 Mt, after 63.511 Mt in the last year and 59.668 Mt in the year before.

In the first 9 months 2025, Türkiye’s cement production increased by +7.5% to 68.244 Mt, after 63.511 Mt in the last year and 59.668 Mt in the year before.
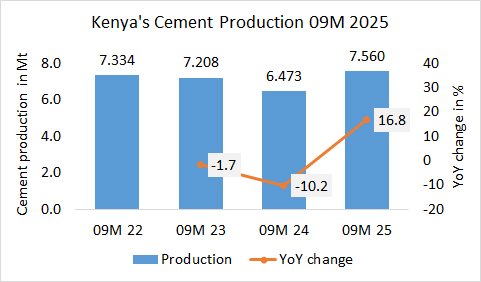
In the first 8 months in 2025, Kenya’s cement production increased by +16.8% to 7.560 Mt, after 6.473 Mt in the same period last year and 7.208 Mt in the year before.
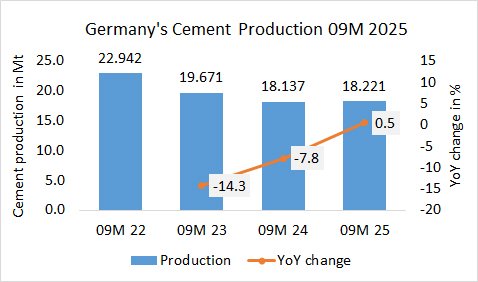
In the first 9 months in 2025, Germany’s cement production increased by +0.5% to 18.221 Mt, after 18.137 Mt in the same period last year and 19.671 Mt in the year before.
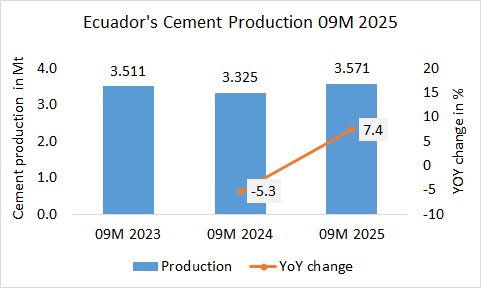
In the first 9 months in 2025, Ecuador’s cement production increased by +7.4% to 3.571 Mt, after 3.325 Mt in the last year and 3.511 Mt in the year before.
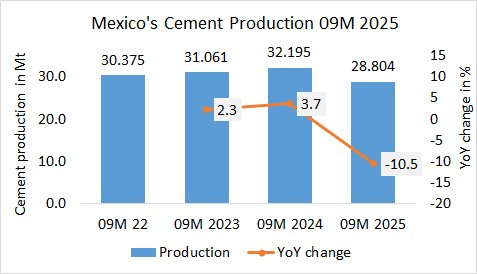
In the first 9 months in 2025, Mexico’s cement production (of integrated plants) decreased by -10.5%% to 28.804 Mt, after 32.195 Mt in the same period last year and 31.061 Mt in the year before.
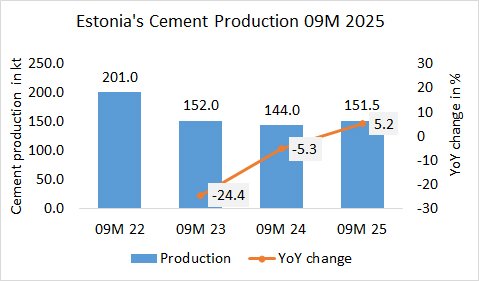
In the first 9 months in 2025, Estonia’s cement production increased by +5.2% to 151.5 kt, after 144.0 kt in the same period last year and 152.0 kt in the year before.
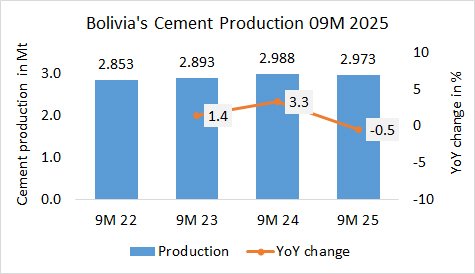
In the first 9 months in 2025, Bolivia’s cement production decreased by -0.5% to 2.973 Mt, after 2.988 Mt in the last year and 2.893 Mt in the year before.
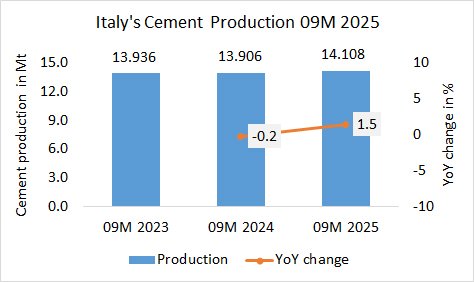
In the first 9 months in 2025, Italy’s cement production increased by +1.5% to 14.108 Mt, after 13.906 Mt in the same period last year and 13.936 Mt in the year before.
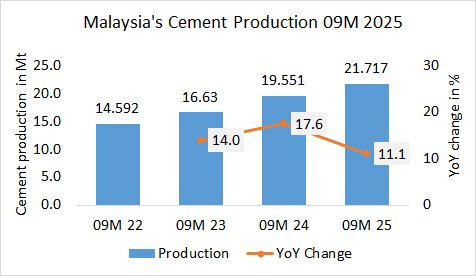
In the first 9 months in 2025, Malaysia’s cement production increased by +11.1% to 21.717 Mt, after 19.551 Mt in the same period last year and 16.630 Mt in the year before
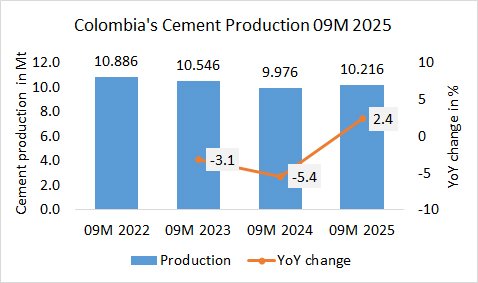
In the first 9 months in 2025, Colombia’s cement production increased by +2.4% to 10.216 Mt, after 9.976Mt in the same period last year and 10.546 Mt in the year before.