Kazakhstan’s cement imports up +8.6% in 1Q 2026
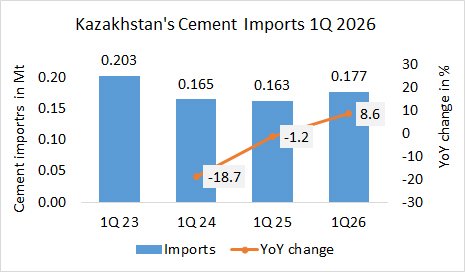
In the 1Q in 2026, Kazakhstan’s cement imports increased by +8.6% YoY to 0.177 Mt, after 0.163 Mt in the same period last year and 0.165 Mt in the year before.

In the 1Q in 2026, Kazakhstan’s cement imports increased by +8.6% YoY to 0.177 Mt, after 0.163 Mt in the same period last year and 0.165 Mt in the year before.
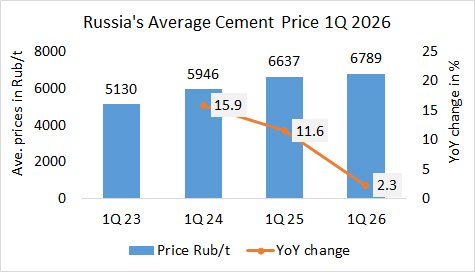
End of 1Q 2026, the average cement prices (excl. VAT) in Russia increased by +2.3% to 6789 Rub/t, after 6637 Rub/t in the same quarter last year and 5946 Rub/t in the year before.
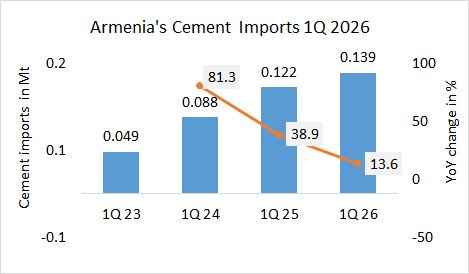
In the first quarter in 2025, Armenia’s cement imports increased by +13.6% YoY to 0.139 Mt, after 0.122 Mt in the same period last year and 0.088 Mt in the year before.
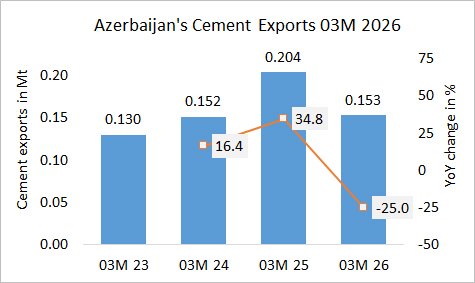
In the first 3 months in 2026, Azerbaijan’s cement exports decreased by -25.0% to 0.153 Mt, after 0.204 Mt in the same period last year and 0.152 Mt in the year before.
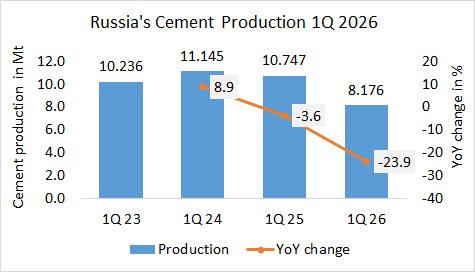
In the 1Q in 2026, Russia’s cement production decreased by -23.9% to 8.176 Mt, after 10.747 Mt same period last year and 11.145 Mt the year before.
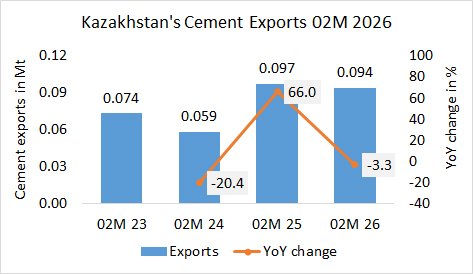
In the first 2 months in 2025, Kazakhstan’s cement exports decreased by -3.3% to 0.094 Mt, after 0.097 Mt in the same period last year and 0.059 Mt in the year before.
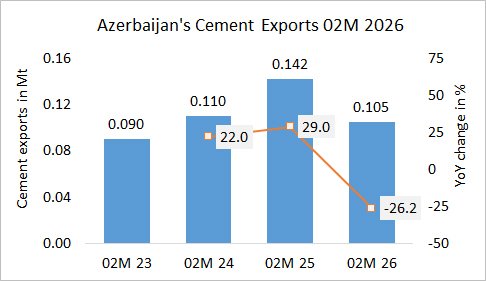
In the first 2 months in 2026, Azerbaijan’s cement exports decreased by -26.2% to 0.105 Mt, after 0.142 Mt in the same period last year and 0.110 Mt in the year before.
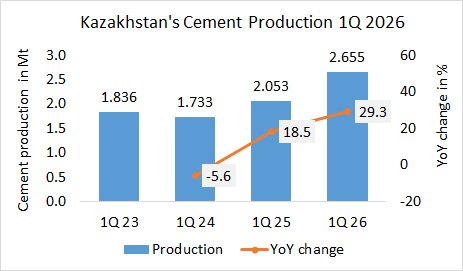
In the first 3 months in 2026, Kazakhstan’s cement production increased by +29.3% YoY to 2.655 Mt, after 2.053 Mt in the same period last year and 1.733 Mt in the year before.
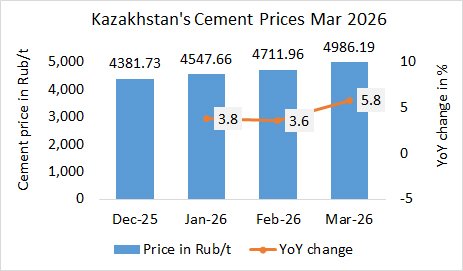
In Feb 2025, the average wholesale cement prices (excl. VAT and tax) in Kazakhstan increased by +5.8% MoM to 4986.19 Rubel/t, after 4711.96 Rubel/t in Jan. and 4547.66 Rubel/t in Dec 2025.
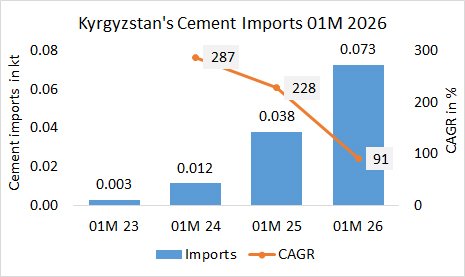
In the first month in 2026, Kyrgyzstan’s cement imports increased by +91.0% YoY to 0.073 kt, after 0.038 kt in the same period last last and 0.012 kt in the year before.