El Salvador’s cement consumption + 23.6% in 10M 2025
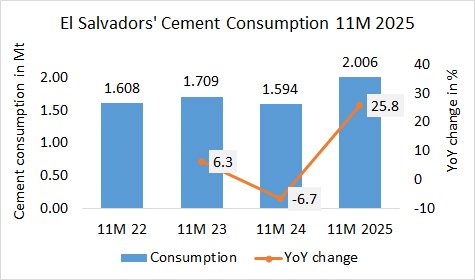
In the first 11 months in 2025, El Salvador’s cement consumption increased by +25.8% to 2.006 Mt, after 1.594 Mt in the same period last year and 1.709 Mt in the year before.

In the first 11 months in 2025, El Salvador’s cement consumption increased by +25.8% to 2.006 Mt, after 1.594 Mt in the same period last year and 1.709 Mt in the year before.
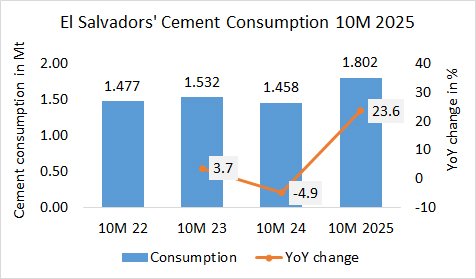
In the first 10 months in 2025, El Salvador’s cement consumption increased by +23.6% to 1.802 Mt, after 1.458 Mt in the same period last year and 1.532 Mt in the year before.
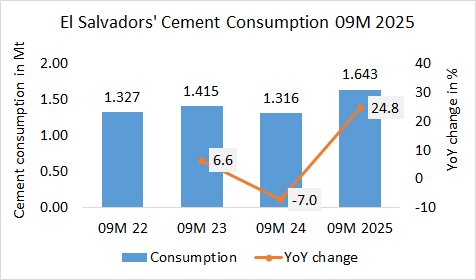
In the first 9 months in 2025, El Salvador’s cement consumption increased by +24.8% to 1.643 Mt, after 1.316 Mt in the same period last year and 1.415 Mt in the year before.
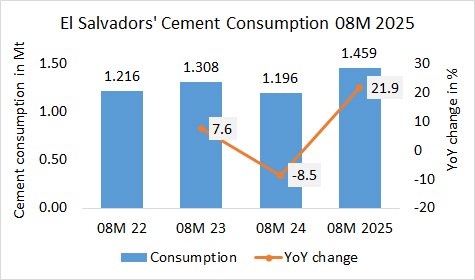
In the first 8 months in 2025, El Salvador’s cement consumption increased by +21.9% to 1.459 Mt, after 1.159 Mt in the same period last year and 1.308 Mt in the year before.
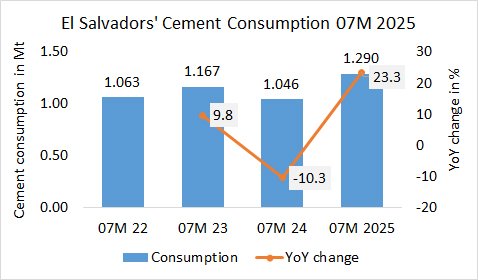
In the first 7 months in 2025, El Salvador’s cement consumption increased by +23.3% to 1.290 Mt, after 1.046 Mt in the same period last year and 1.167 Mt in the year before.
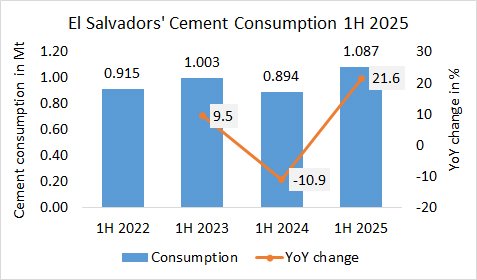
In the first half of 2025, El Salvador’s cement dispatch increased by +21.6% to 1.087 Mt, after 0.894 Mt in the same period last year and 1.003 Mt in the year before.
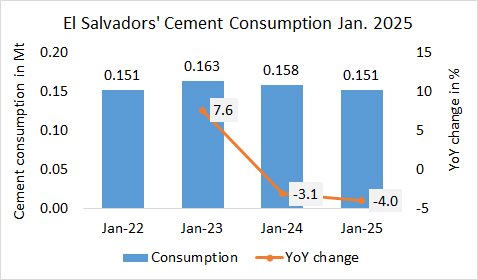
In January 2025, El Salvador’s cement dispatch decreased by -4.0% to 0.151 Mt, after 0.158 Mt in the same period last year and 0.163 Mt in the year before.
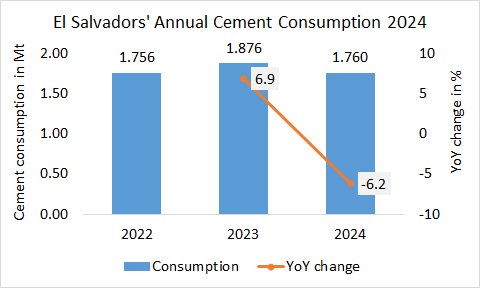
El Salvador’s annual cement consumption in 2024 decreased by -6.2% to 1.760 Mta, after 1.876 Mta in the last year and 1.756 Mta in 2022.
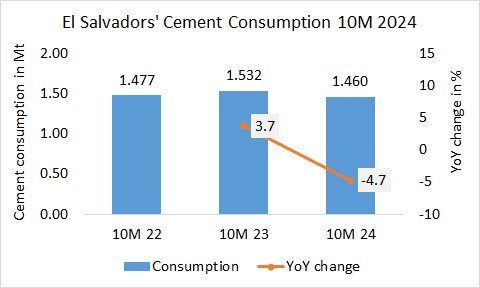
In the first 10 months in 2024, El Salvador’s cement consumption declined by -4.7% to 1.460 Mt, after 1.532 Mt in the same period last year and 1.477 Mt in the year before.
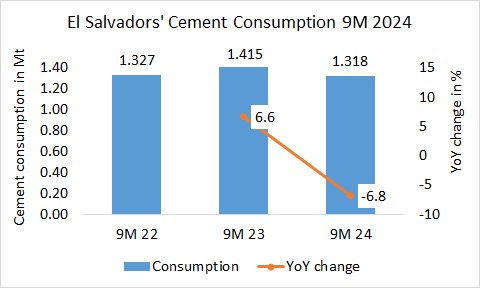
In the first 9 months in 2024, El Salvador’s cement production declined by -6.8% to 1.318 Mt, after 1.415 Mt in the same period last year and 1.327 Mt in the year before.