Puerto Rico’s cement production up +7.5% in Fiscal 2026
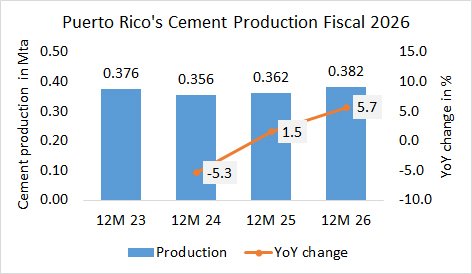
In the Fiscal Year 2026, (July 25-Jun 26) Puerto Rico’s cement production increased by +5.7% to 0.382 Mt, after 0.362 Mt in the same period last year and 0.356 Mt in the year before.

In the Fiscal Year 2026, (July 25-Jun 26) Puerto Rico’s cement production increased by +5.7% to 0.382 Mt, after 0.362 Mt in the same period last year and 0.356 Mt in the year before.

In the first 9 months of 2025, Puerto Rico’s cement sales (production and imports) increased by +7.5% to 0.504 Mt, after 0.468 Mt in the same period last year and 0.478 Mt in the year before.
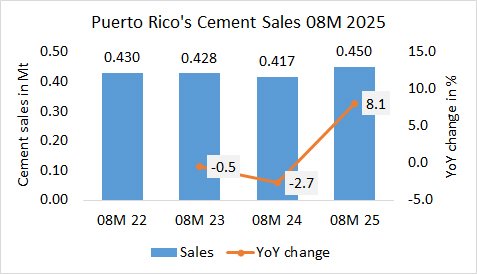
In the first 8 months of 2025, Puerto Rico’s cement sales (production and imports) increased by +8.1% to 0.450 Mt, after 0.417 Mt in the same period last year and 0.428 Mt in the year before.
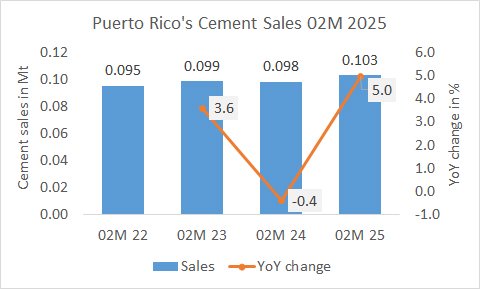
In the first 2 months of 2025, Puerto Rico’s cement sales increased by +5.0% to 0.103 Mt, after 0.098 Mt in the same period last year and 0.099 Mt in the year before.
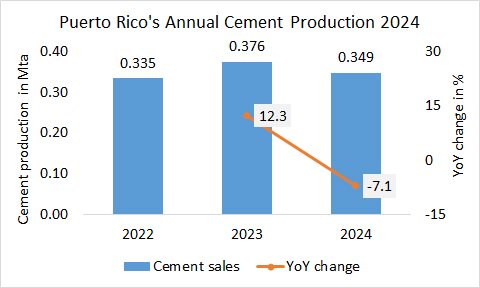
The annual cement production in Puerto Rico declined by -7.1% to 0.349 Mta, after 0.376 Mta in the last year and 0.335 Mta in 2022.
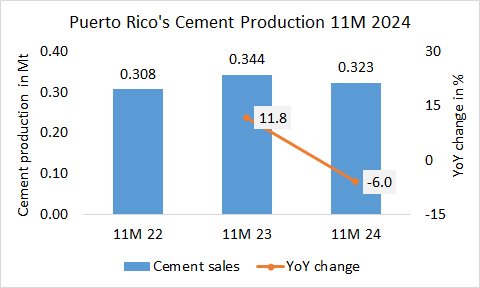
In the first 11 months in 2024, Puerto Rico’s cement production declined by -6.0% to 0.323 Mt, after 0.344 Mt in the same period last year and 0.308 Mt in the year before.
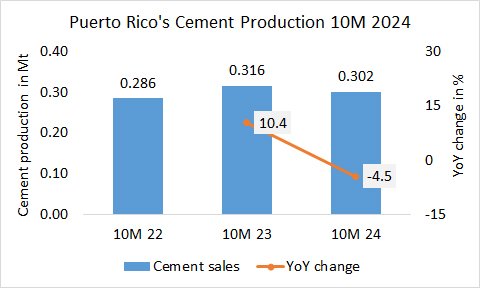
In the first 10 months in 2024, Puerto Rico’s cement production declined by -4.5% to 0.302 Mt, after 0.316 Mt in the same period last year and 0.286 Mt in the year before.
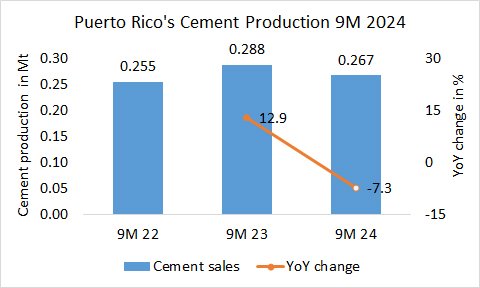
In the first 9 months in 2024, Puerto Rico’s cement production declined by -7.3% to 0.267 Mt, after 0.288 Mt in the same period last year and 0.255 Mt in the year before.
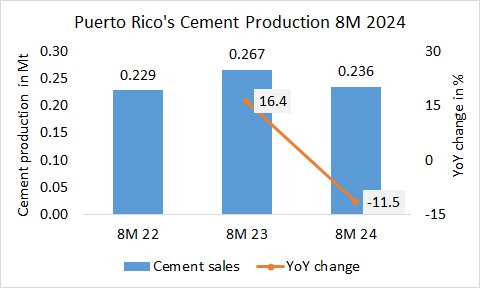
In the first 8 months of 2024, Puerto Rico’s cement production declined by -11.5% to 0.236 Mt, after 0.267 Mt in the same period last year and 0.229 Mt in the year before.
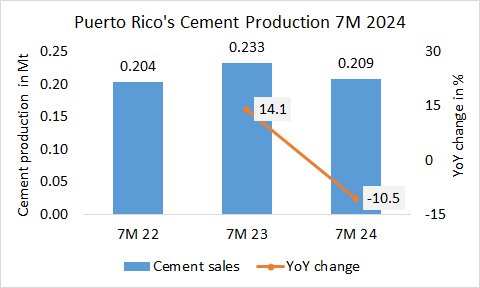
In the first 7 months of 2024, Puerto Rico’s cement production declined by -10.5% to 0.209 Mt, after 0.233 Mt in the same period last year and 0.204 Mt in the year before.