Liberia’s cement production -12.6% in 02M 2025
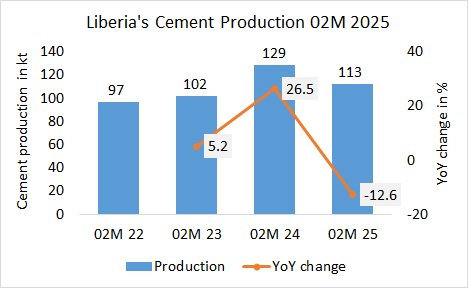
In the first 2 months in 2025, Liberia’s cement production decreased by -12.6% to 113 kt, after 129 kt in the same period last year and 102 kt in the year before.

In the first 2 months in 2025, Liberia’s cement production decreased by -12.6% to 113 kt, after 129 kt in the same period last year and 102 kt in the year before.

In the first 2 months in 2025, Germany’s cement production declined by -0.7% to 2.552 Mt, after 2.571 Mt in the same period last year and 3.188 Mt in the year before.
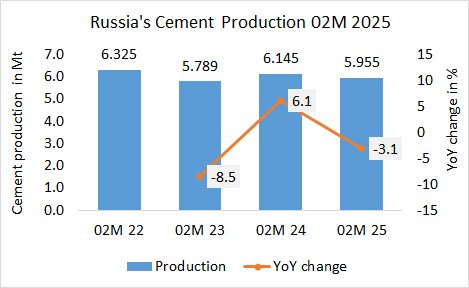
In the first 2 months in 2025, Russia’s cement production decreased by -3.1% to 5.955 Mt, after 6.145 Mt in the same period last year and 5.789 Mt in the year before.
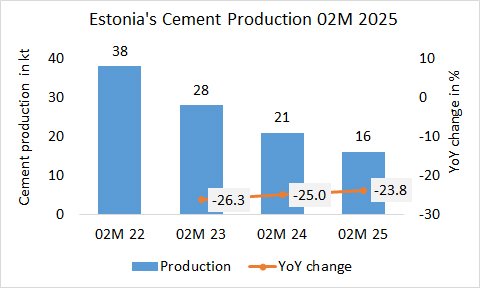
In the first 2 months in 2025, Estonia’s cement production decreased by -23.8% to 16 kt, after 21 kt in the same period last year and 28 kt in the year before.
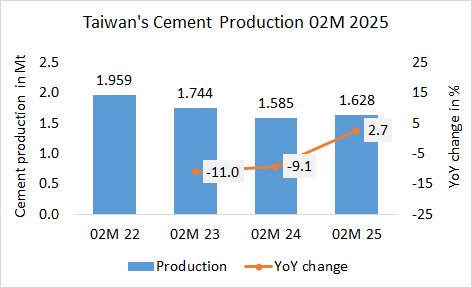
In the first 2 months in 2025, Taiwan’s cement production increased by +2.7% to 1.628 Mt, after 1.585 Mt in the same period last year and 1.744 Mt in the year before.
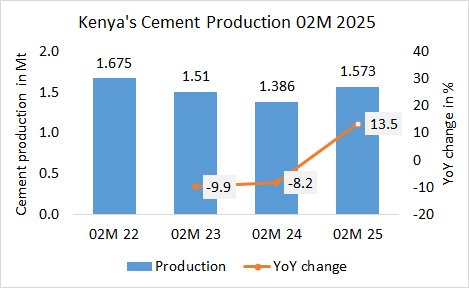
In the first 2 months of 2025, Kenya’s cement production increased by +13.5% to 1.573 Mt, after 1.386 Mt same period last year and 1.510 Mt the year before.
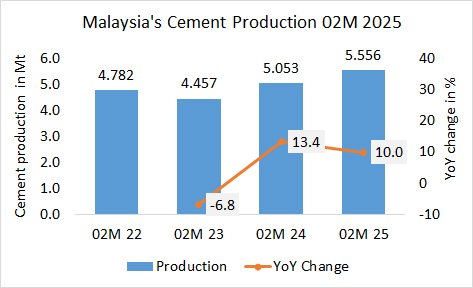
In the first 2 months of 2025, Malaysia’s cement production increased by +10.0% to 5.556 Mt, after 5.053 Mt same period last year and 4.457 Mt the year before.
In the first 2 months of 2025, Japan’s cement production decreased by -4.7% to 6.790 Mt, after 7.125 Mt same period last year and 7.608 Mt the year before.
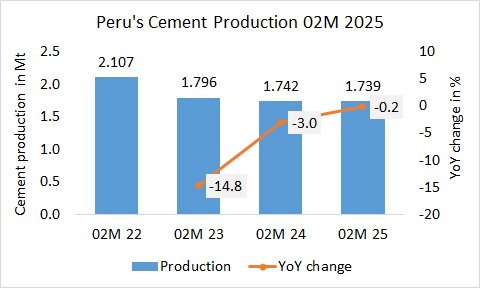
In the first 2 months of 2025, Peru’s cement production decreased by -0.2% to 1.739 Mt, after 1.742 Mt in the same period last year and 1.796 Mt in the year before.
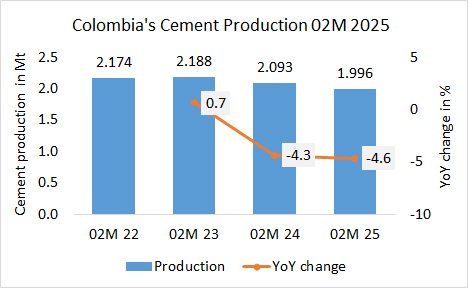
In the first 2 months of 2025, Colombia’s cement production decreased by -4.6% to 1.996 Mt, after 2.093 Mt in the same period last year and 2.188 Mt in the year before.