Germany’s cement production up +0.7% in 08M 2025
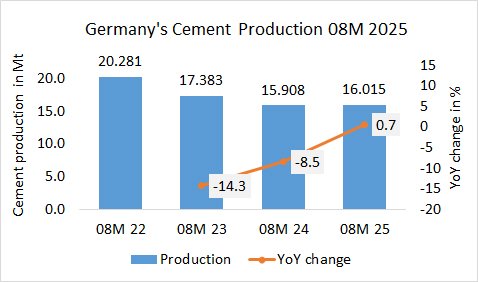
In the first 8 months in 2025, Germany’s cement production increased by +0.7% to 16.015 Mt, after 15.908 Mt in the same period last year and 17.383 Mt in the year before.

In the first 8 months in 2025, Germany’s cement production increased by +0.7% to 16.015 Mt, after 15.908 Mt in the same period last year and 17.383 Mt in the year before.
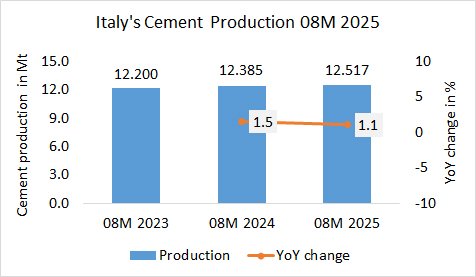
In the first 8 months in 2025, Italy’s cement production increased by +1.1% to 12.517 Mt, after 12.385 Mt in the same period last year and 12.200 Mt in the year before.

In the first 8 months in 2025, Kenya’s cement production increased by +18.1% to 6.683 Mt, after 5.659 Mt in the same period last year and 6.373 Mt in the year before.

In the first 8 months in 2025, Taiwan’s cement production increased by +6.2% to 7.015 Mt, after 6.609 Mt in the same period last year and 6.912 Mt in the year before.
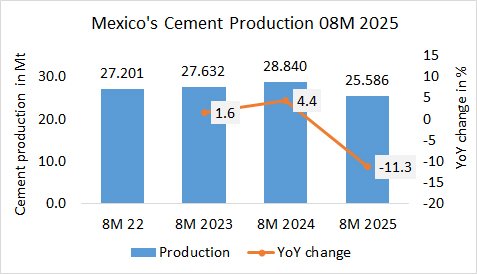
In the first 8 months in 2025, Mexico’s cement production (of integrated plants) decreased by -11.3%% to 25.586 Mt, after 28.840 Mt in the same period last year and 27.632 Mt in the year before.
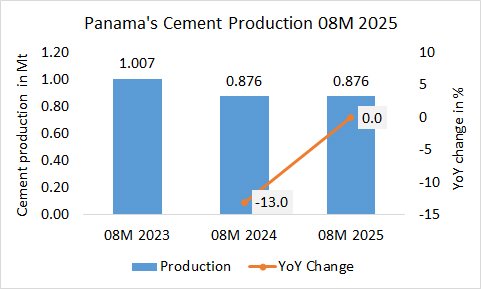
In the first 8 months in 2025, Panama’s cement production has been stable at 0.876 Mt, exactly the same amount as in the first 8 month last year, but lower than the 1.007 Mt in the year before.
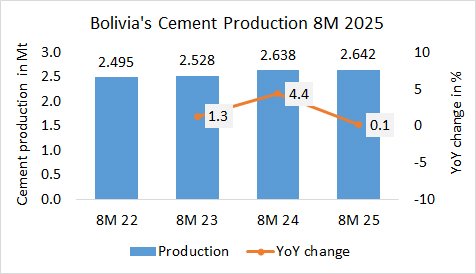
In the first 8 months in 2025, Bolivia’s cement production increased by +0.1% to 2.642 Mt, after 2.638 Mt in the last year and 2.528 Mt in the year before, despite the economic and political crisis in the country.
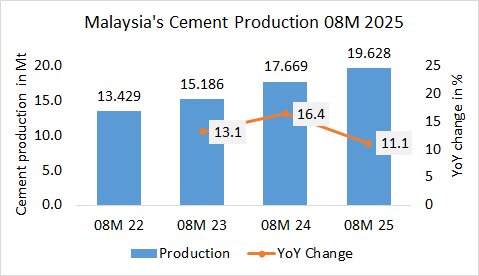
In the first 8 months in 2025, Malaysia’s cement production increased by +11.1% to 19.628 Mt, after 17.669Mt in the same period last year and 15.186 Mt in the year before.
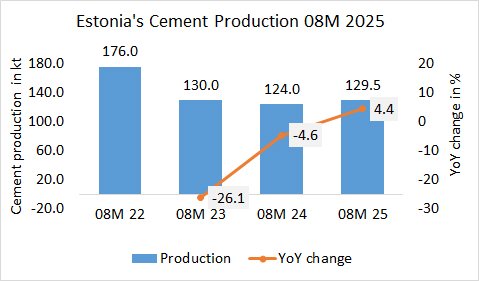
In the first 8 months in 2025, Estonia’s cement production increased by +4.4% to 129.5 kt, after 124.0 kt in the same period last year and 130.0 kt in the year before.
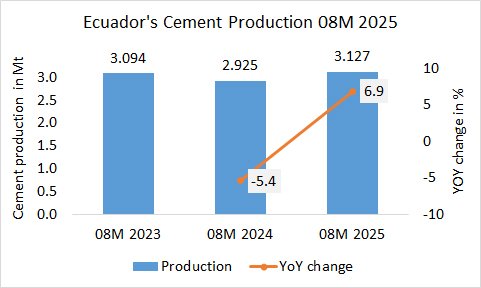
In the first 8 months in 2025, Ecuador’s cement production increased by +6.9% to 3.127 Mt, after 2.925 Mt in the last year and 3.094 Mt in the year before.