Peru’s cement production up +12.1% in 1H 2026
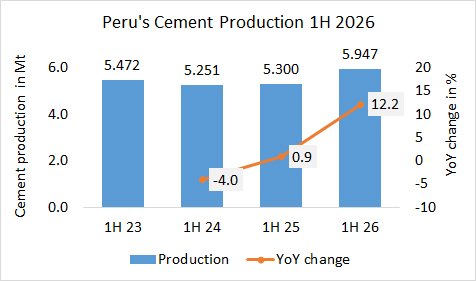
In the 1H in 2026, Peru’s cement production (Asocem associated producers) increased by +12.2% YoY to 5.947 Mt, after 5.300 Mt in the same period last year and 5.251 Mt in the year before.

In the 1H in 2026, Peru’s cement production (Asocem associated producers) increased by +12.2% YoY to 5.947 Mt, after 5.300 Mt in the same period last year and 5.251 Mt in the year before.
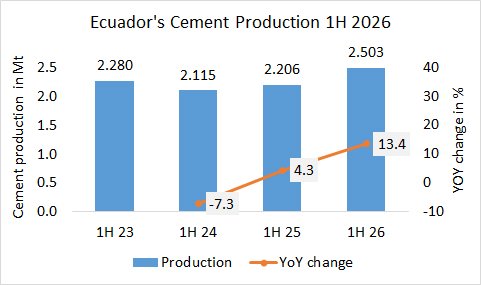
In the 1H in 2026, Ecuador’s cement production increased by +13.4% YoY to 2.503 Mt, after 2.206 Mt in the same period last year and 2.115 Mt in the year before.
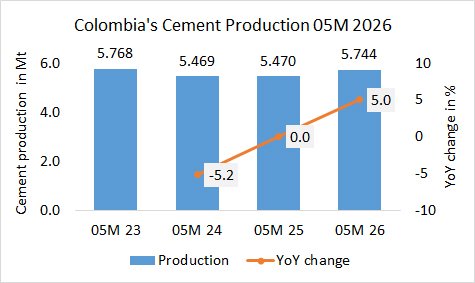
In the first 5 months in 2026, Colombia’s cement production increased by +5.0% YoY to 5.744 Mt, after 5.470 Mt in the same period last year and 5.469 Mt in the year before.
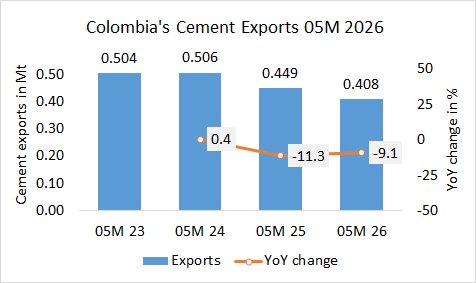
In the first 5 months in 2026, Colombia’s cement exports decreased by -9.1% YoY to 0.408 Mt, after 0.449 Mt in the same period last year and 0.506 Mt in the year before.
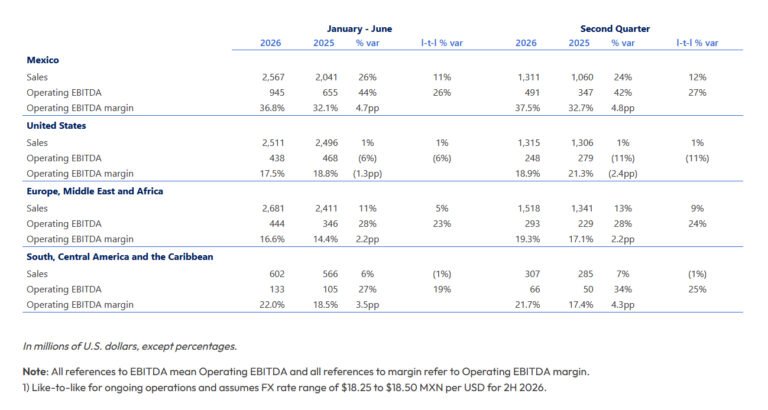
Mexico HQ Cemex announced its results for the second quarter of 2026, with strong growth across all metrics, driven by the progress made towards its transformation goals. EBITDA reached a record US$1 billion, increasing 24% year-over-year driven by project cutting…
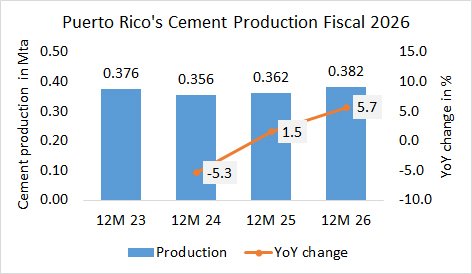
In the Fiscal Year 2026, (July 25-Jun 26) Puerto Rico’s cement production increased by +5.7% to 0.382 Mt, after 0.362 Mt in the same period last year and 0.356 Mt in the year before.
Brazil’s leading cement producer Votorantim has announced an investment of BRL260m (US$51m) to expand its cement plant in the state of Tocantins with an additional grinding line. The project, which is scheduled for completion in July 2028, will add 0.5…
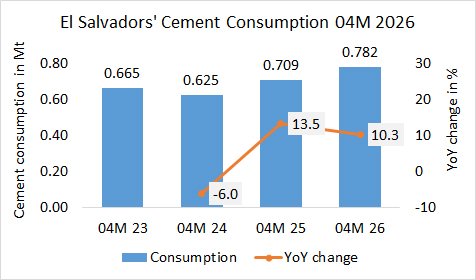
In the first 04 months in 2026, El Salvador’s cement consumption increased by +10.3% YoY to 0.782 Mt, after 0.709 Mt in the same period last year and 0.625 Mt in the year before.
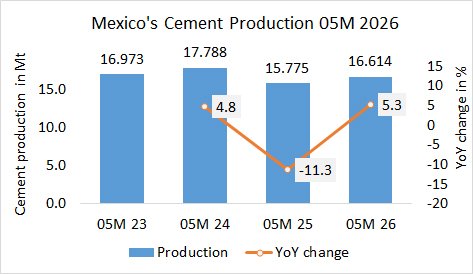
In the first 05 months in 2026, Mexico’s cement production (of integrated plants) increased by +5.3% YoY to 16.514 Mt, after 15.775 Mt in the same period last year and 17.788 Mt in the year before.
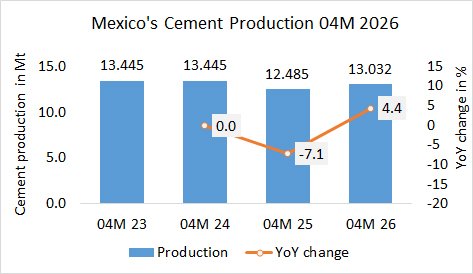
In the first 04 months in 2026, Mexico’s cement production (of integrated plants) increased by +4.4% YoY to 13.032 Mt, after 12.485 Mt in the same period last year and 13.445 Mt in the year before.