Mexico’s cement production up +4.6% in 01M 2026
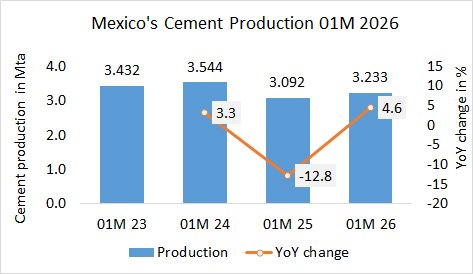
In the first month in 2026, Mexico’s cement production (of integrated plants) increased by +4.6% to 3.233 Mt, after 3.092 Mt in the same period last year and 3.544 Mt in the year before.

In the first month in 2026, Mexico’s cement production (of integrated plants) increased by +4.6% to 3.233 Mt, after 3.092 Mt in the same period last year and 3.544 Mt in the year before.
CSN (Companhia Siderúrgica Nacional), Brazil’s major steelmaker is moving forward with its plans to find a new partner for its cement division to cut increasing debts (we reported here 20.01.2026). It has been reported that Morgan Stanley has been hired…
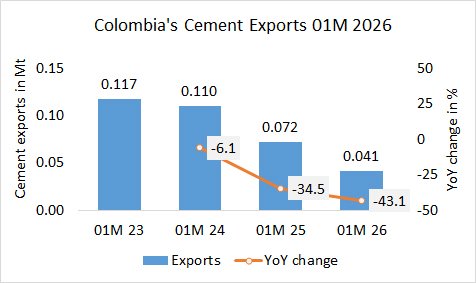
In the first month in 2026, Colombia’s cement exports decreased by -43.1% YoY to 0.041 Mt, after 0.072 Mt in the same period last year and 0.110 Mt in the year before.
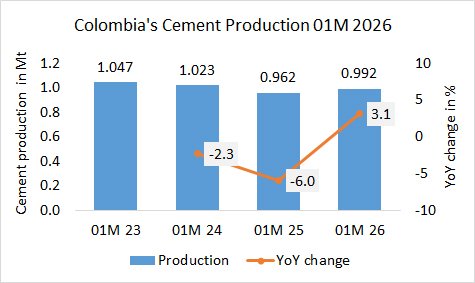
In the first month in 2026, Colombia’s cement production increased by +3.1% YoY to 0.992 Mt, after 0.962 Mt in the same period last year and 1.023 Mt in the year before.

Cemex announced that it is in the process of divesting certain operations in Colombia. The divestment is expected to take place through several separate transactions with different parties by the end of the year. In a first step, the company…
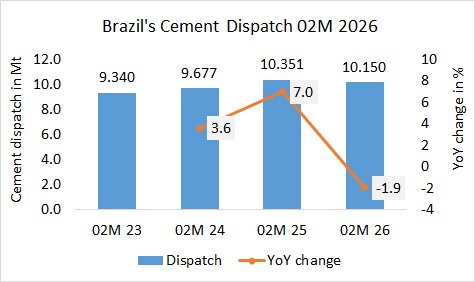
In the first 2 months in 2026, Brazil’s cement dispatch decreased by -1.9% to 10.150 Mt, after 10.351 Mt in the same period last year and 9.677 Mt in the year before.
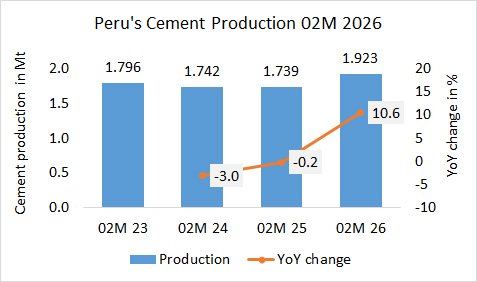
In the first 2 months in 2026, Peru’s cement production increased by +10.6% YoY to 1.923 Mt, after 1.739 Mt in the same period last year and 1.742 Mt in the year before.
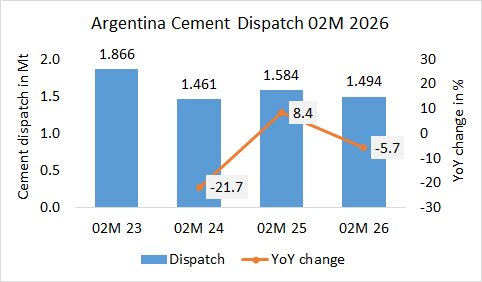
In the first 2 months in 2026, Argentina’s cement dispatch decreased by -5.7% to 1.494 Mt, after 1.584 Mt in the same period last year and 1.461 Mt in the year before.
Last month, the new 3500 tpd clinker production line of Cimentos Cibao in the Dom. Rep., supplied by Sinoma TCDRI, received the Provisional Acceptance Certificate (PAC). The new kiln line replaces two older, smaller kilns to boost efficiency and modernize…
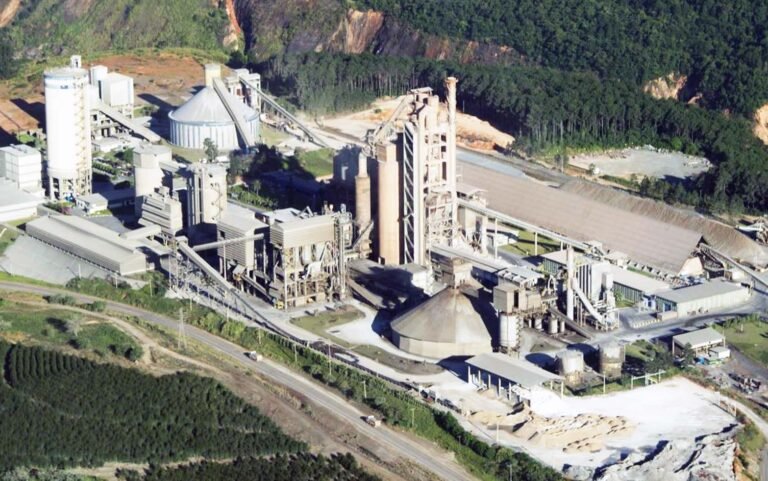
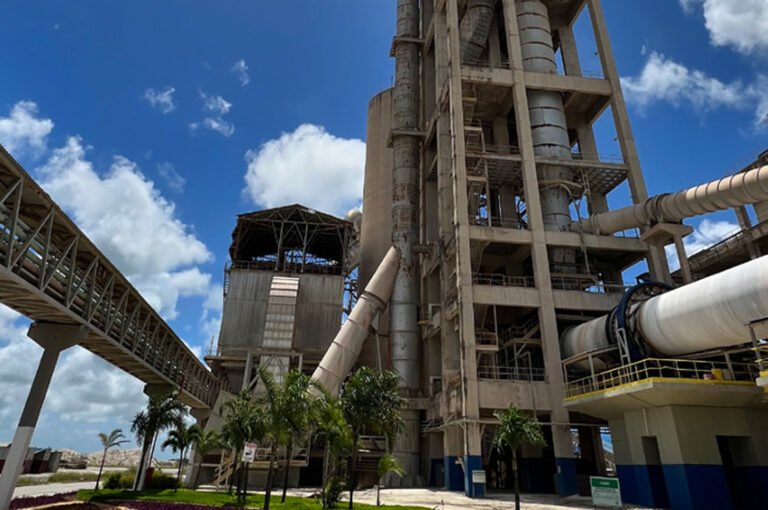
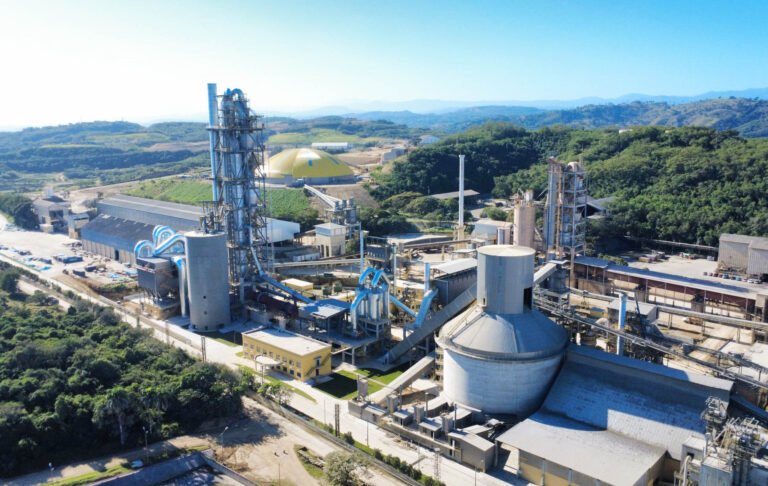
As part of an R$ 5bn investment programme, Votorantim Cimentos is expanding its cement capacity in Brazil by 3.7 Mta. This includes the completed production capacity increase at the Salto de Pirapora (SP) plant (photo), the modernisation of a cement…