Taiwan’s cement production up +2.3% in 12M 2025
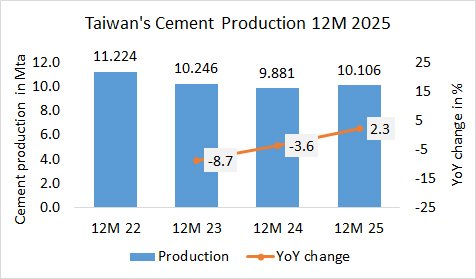
In the year 2025, Taiwan’s cement production increased by +2.3% to 10.106 Mt, after 9.881 Mt in 2024 and 10.246 Mt in 2023.

In the year 2025, Taiwan’s cement production increased by +2.3% to 10.106 Mt, after 9.881 Mt in 2024 and 10.246 Mt in 2023.
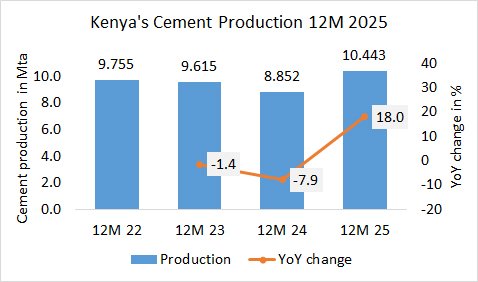
In the year 2025, Kenya’s cement production increased by +18.0% to 10.443 Mta, after 8.852 Mta in 2024 and 9.615 Mta in the 2023.
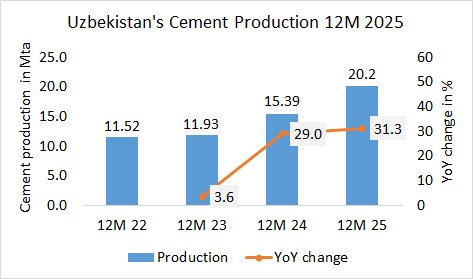
In the year 2025, Uzbekistan’s cement production of the large cement plants increased by +31.3% to 20.2 Mta, after 19.39 Mta in 2024 and 11.93 Mta in the 2023.
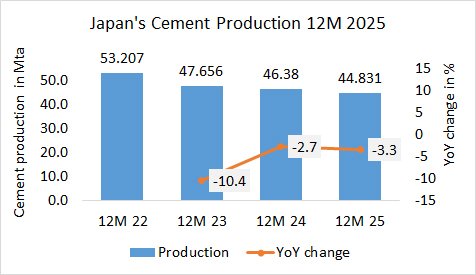
In the year 2025, Japan’s cement production decreased by -3.3% to 44.831 Mta, after 46.380 Mta in 2024 and 47.656 Mta in the 2023.
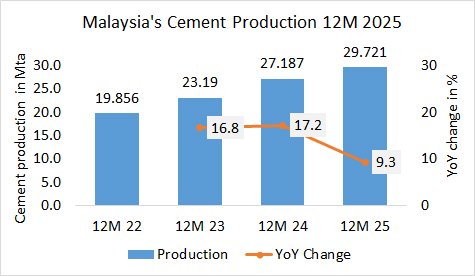
In the year 2025, Malaysia’s cement production increased by +9.3% to 29.721 Mta, after 27.187 Mta in 2024 and 23.190 Mta in the 2023.
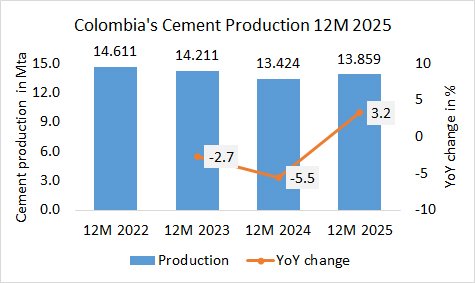
In the year 2025, Colombia’s cement production increased by +3.2% to 13.859 Mta, after 13.424 Mta in 2024 and 14.211 Mta in the 2023.
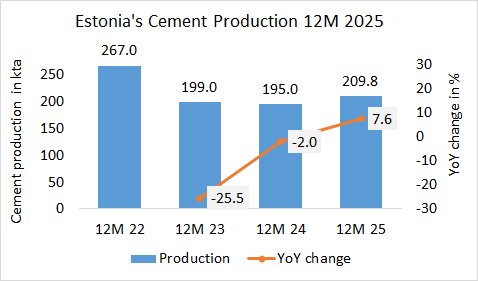
In 2025, Estonia’s cement production increased by +7.6% to 209.8 kta, after 195.0 kta in 2024 and 199.0 kta in the 2023.
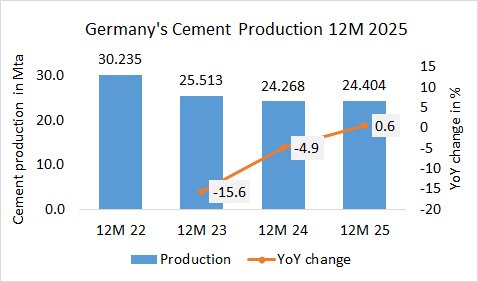
In the year 2025, Germany’s cement production increased by +0.6% to 24.404 Mta, after 24.268 Mta in 2024 and 25.513 Mta in the 2023.
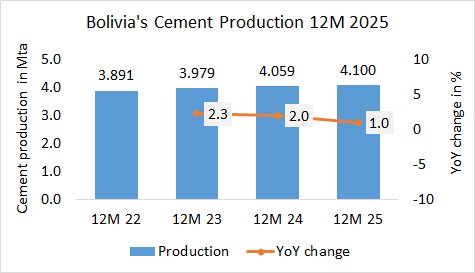
In the year 2025, Bolivia’s cement production increased by +1.0% to 4.100 Mta, after 4.059 Mta in 2024 and 3.979 Mta in the 2023.

In the year 2025, Russia’s cement production decreased by -9.6% to 58.872 Mta, after 65.124 Mta in 2024 and 62.851 Mta in 2023.