Armenia’s cement imports up +7.7% in 05M 2026

In the first quarter in 2026, Armenia’s cement imports increased by +7.7% YoY to 0.267 Mt, after 0.248 Mt in the same period last year and 0.196 Mt in the year before.

In the first quarter in 2026, Armenia’s cement imports increased by +7.7% YoY to 0.267 Mt, after 0.248 Mt in the same period last year and 0.196 Mt in the year before.
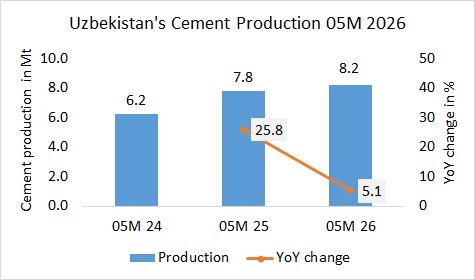
In the first 5 months 2026, Uzbekistan’s cement production of the large cement plants increased by +5.1% to 8.2 Mt, after 7.8 Mt in the same period last year and 6.2 Mt in the year before.
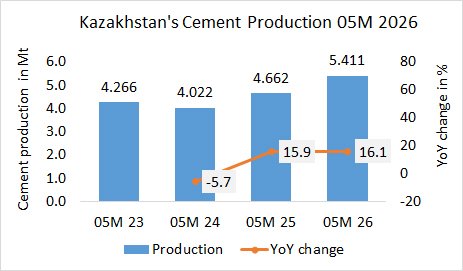
In the first 5 months in 2026, Kazakhstan’s cement production increased by +16.1% YoY to 5.411 Mt, after 4.662 Mt in the same period last year and 4.022 Mt in the year before.
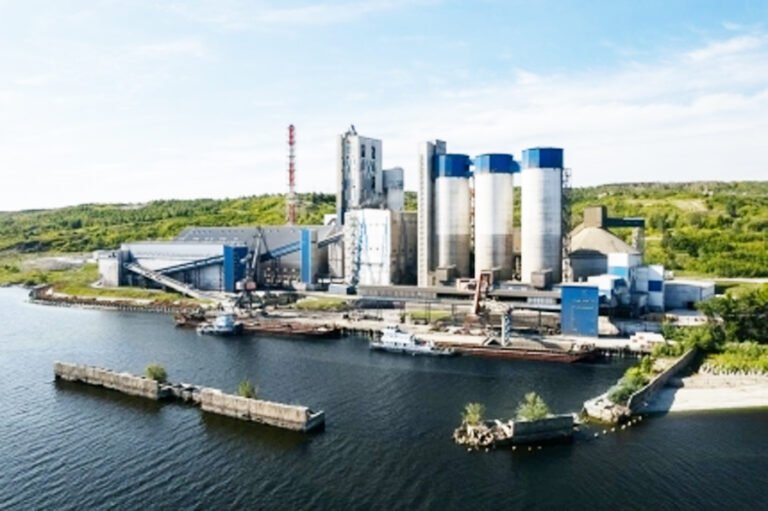
Russia’s CEMROS is working on initiatives, which aim to reduce the water consumption by installing circulation systems. For example, the Sengileevsky branch (photo) of the company is working on the implementation of an environmental project to introduce a closed water…

End of April 2026, the average cement prices (excl. VAT) in Russia decreased by 0.1% to 6997 Rub/t, after 7002 Rub/t in the same month last year and 6115 Rub/t in the year before.

Groundbreaking ceremony for an integrated 1.3 Mta greenfield cement plant of QazCem Industries in the Aktobe region in Kazakhstan. The US$ 176.9 million project is a JV by Kazakh investment company Primus Capital, Chinese Tianshan Materials Company and Sinoma Cement,…
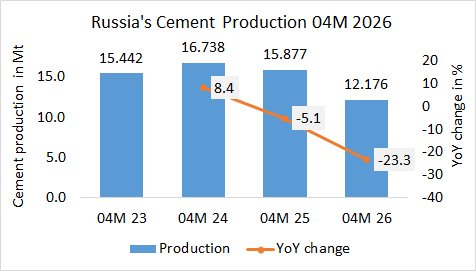
In the first 4 months, Russia’s cement production decreased by -23.3% to 12.176 Mt, after 15.877 Mt same period last year and 16.738 Mt the year before.
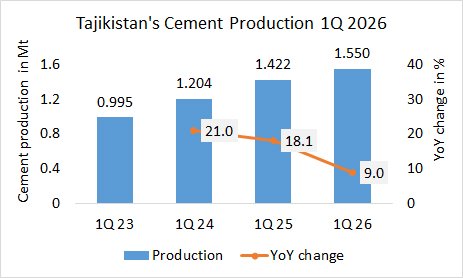
In the 1Q in 2026, Tajikistan’s cement production increased by +9.0% YoY to 1.550 Mt, after 1.422 Mt in the same period last year and 1.204 Mt in the year before.

In a meeting with the National Agency for Investments of Kyrgyzstan, Xintai Yanlin Cement expressed interest to build a modern cement production plant in the country. The plant shall have a production capacity about 3200 tpd. During the meeting, potential…
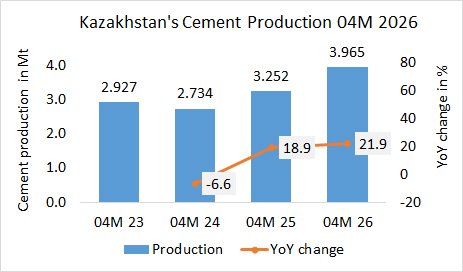
In the first 4 months in 2026, Kazakhstan’s cement production increased by +21.9% YoY to 3.965 Mt, after 3.252 Mt in the same period last year and 2.734 Mt in the year before.