Uzbekistan’s cement production up +30.1% in 11M 2025
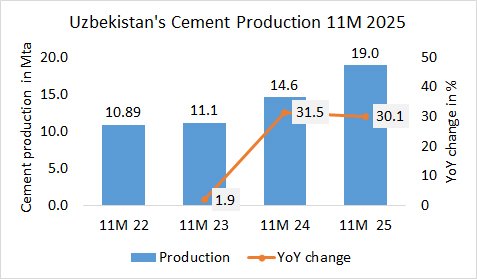
In the first 11 months 2025, Uzbekistan’s cement production of the large cement plants increased by +30.1% to 19.0Mt, after 14.6 Mt in the same period last year and 11.2 Mt in the year before.

In the first 11 months 2025, Uzbekistan’s cement production of the large cement plants increased by +30.1% to 19.0Mt, after 14.6 Mt in the same period last year and 11.2 Mt in the year before.
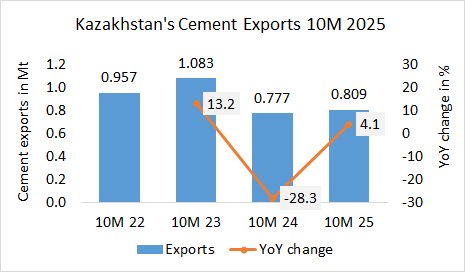
In the first 10 months in 2025, Kazakhstan’s cement exports increased by +4.1% to 0.809 Mt, after 0.777 Mt in the same period last year and 1.083 Mt in the year before.
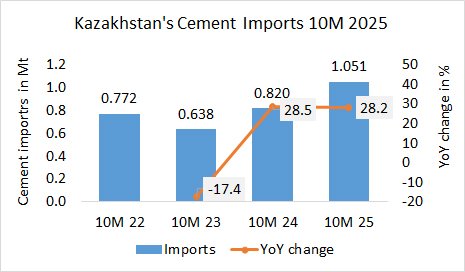
In the first 10 months in 2025, Kazakhstan’s cement imports increased by +28.2% to 1.051 Mt, after 0.820 Mt in the same period last year and 0.638 Mt in the year before.
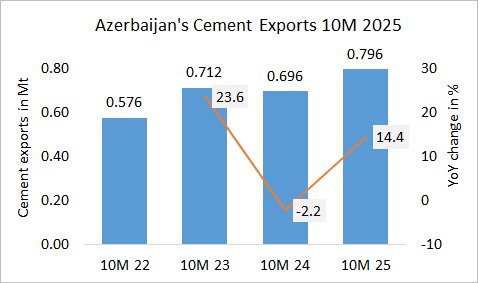
In the first 10 months in 2025, Azerbaijan’s cement exports increased by +14.4% to 0.796 Mt, after 0.696 Mt in the same period last year and 0.712 Mt in the year before.
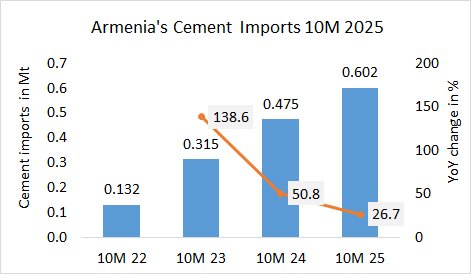
In the first 10 months in 2025, Armenia’s cement imports increased by +26.7% to 0.602 Mt, after 0.475 Mt in the same period last year and 0.315 Mt in the year before.
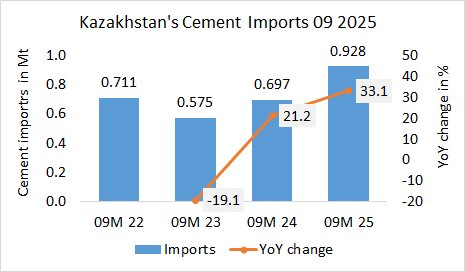
In the first 9 months in 2025, Kazakhstan’s cement imports increased by +33.1% to 0.928 Mt, after 0.697 Mt in the same period last year and 0.575 Mt in the year before.
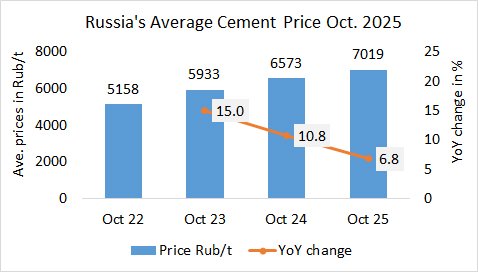
In October 2025, the average cement prices in Russia increased by +6.8% YoY to 7019 Rub/t, after 6573 Rub/t in the same period last year and 5933 Rub/t in the year before.
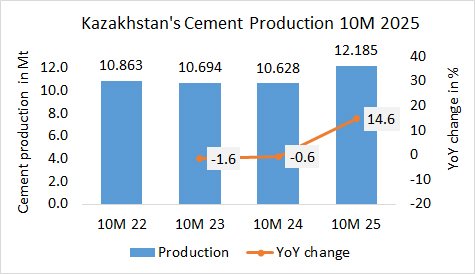
In the first 10 months in 2025, Kazakhstan’s cement production increased by +14.6% to 12.185 Mt, after 10.628 Mt in the same period last year and 10.694 Mt in the year before.
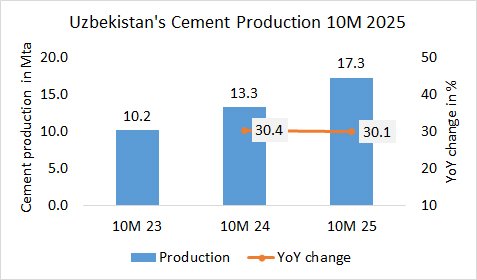
In the first 10 months 2025, Uzbekistan’s cement production of the large cement plants increased by +30.1% to 17.3Mt, after 13.3 Mt in the same period last year and 10.2 Mt in the year before.
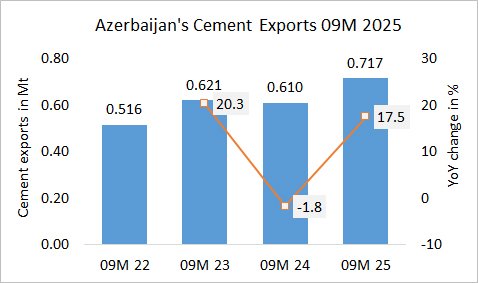
In the first 9 months in 2025, Azerbaijan’s cement exports increased by +17.7% to 0.717 Mt, after 0.610 Mt in the same period last year and 0.621 Mt in the year before.