Argentina’s cement dispatch up +12.5 in 1H 2025
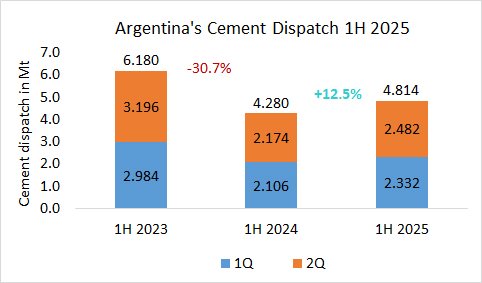
In the first half in 2025, Argentina’s cement dispatch (local dispatch and exports) increased by +12.5% to 4.814 Mt, after 4.280 Mt in the same period last year and 6.180 Mt in the year before.

In the first half in 2025, Argentina’s cement dispatch (local dispatch and exports) increased by +12.5% to 4.814 Mt, after 4.280 Mt in the same period last year and 6.180 Mt in the year before.
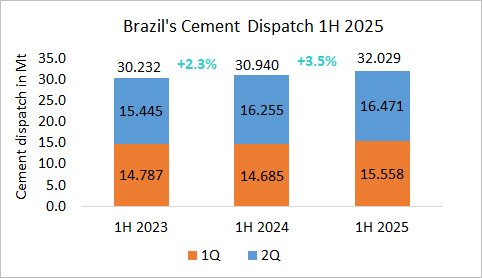
In the first half in 2025, Brazil’s cement dispatch increased by +3.5% to 32.029 Mt, after 30.940 Mt in the same period last year and 30.232 Mt in the year before.
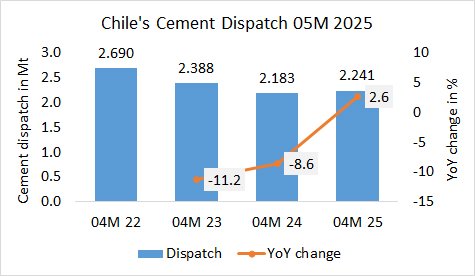
In the first 5 months in 2025, Chile’s cement dispatch increased by +2.6% to 2.241 Mt, after 2.183 Mt in the same period last year and 2.388 Mt in the year before.
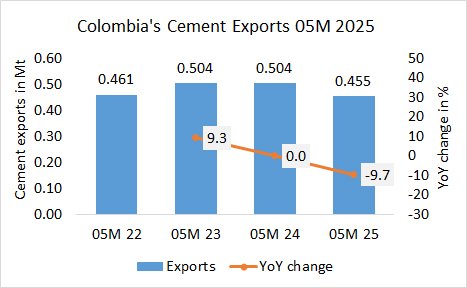
In the first 5 months in 2025, Colombia’s cement exports declined by -9.7% to 0.455 Mt, after 0.504 Mt in the same period last year and 0.504 Mt in the year before.
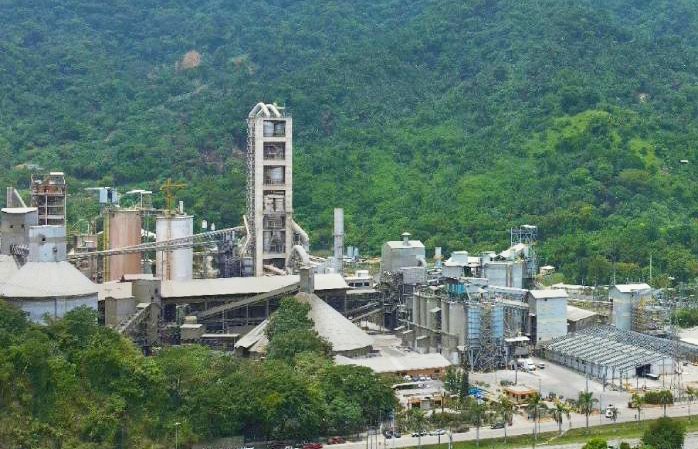
Honduras’ CENOSA (Cementos del Norte), has commissioned a new VRM in its Bijao cement plant in Choloma, which has a cement capacity of 2.3 Mta. The new VRM is a Loesche LM 46.2+2 for the grinding of blended cements. The…
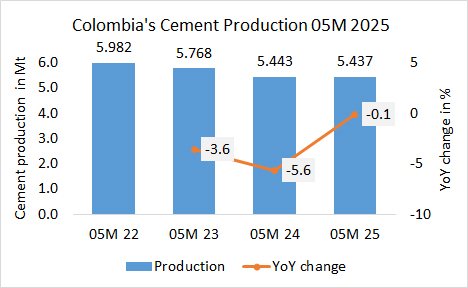
In the first 5 months in 2025, Colombia’s cement production declined by -0.1% to 5.437 Mt, after 5.443 Mt in the same period last year and 5.768 Mt in the year before.
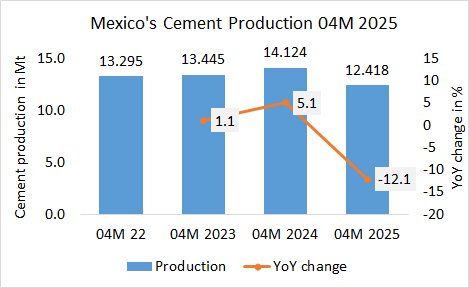
In the first 4 months in 2025, Mexico’s cement production (of integrated plants) decreased by -12.1%% to 12.4184 Mt, after 14.124 Mt in the same period last year and 11.445 Mt in the year before.

The upgrade of the ‘green’ cement plant of Cementos PANAM, which is part of the ESTRELLA Group, located in El Coco in Dom. Rep. has been completed. The plant (photo) has been equipped with a modern VRM by Gebr. Pfeiffer…
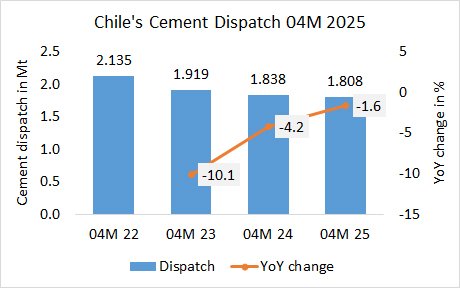
In the first 4 months in 2025, Chile’s cement dispatch declined by -1.6% to 1.808 Mt, after 1.838 Mt in the same period last year and 1.919 Mt in the year before.
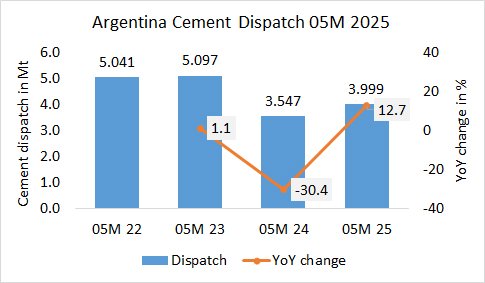
In the first 5 months in 2025, Argentina’s cement dispatch increased by +12.7% to 3.999 Mt, after 3.547 Mt in the same period last year and 5.097 Mt in the year before.