Brazil’s cement dispatch up +4.0% in 11M 2024

In the first 11 months in 2024, Brazil’s cement production increased by +4.0% to 60.026 Mt, after 57.715 Mt in the same period last year.

In the first 11 months in 2024, Brazil’s cement production increased by +4.0% to 60.026 Mt, after 57.715 Mt in the same period last year.

In the first 11 months in 2024, Argentina’s cement production declined by -25.2% to 8.783 Mt, after 11.741 Mt in the same period last year and 12.035 Mt in the year before.

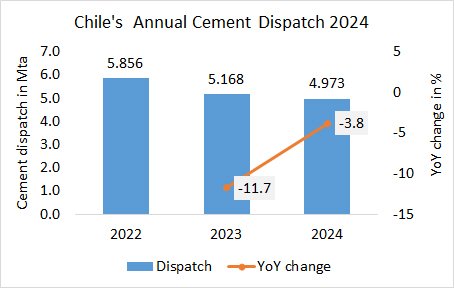
In the first 10 months in 2024, Chile’s cement dispatch declined by -4.7% to 4.115 Mt, after 4.316 Mt in the same period last year and 4.899 Mt in the year before.

In the first 9 months in 2024, El Salvador’s cement production declined by -6.8% to 1.318 Mt, after 1.415 Mt in the same period last year and 1.327 Mt in the year before.

In the first 10 months in 2024, Colombia’s cement production declined by -5.5% to 11.158 Mt, after 11.808 Mt in the same period last year and 12.135 Mt in the year before.

In the first 9 months of 2024, Peru’s cement production declined by -3.0% to 9.199 Mt, after 9.487 Mt in the same period last year and 10.996 Mt in the year before.

In the first 9 months of 2024, Panama’s cement production declined by -9,6% to 0,968 Mt, after 1.070 Mt in the same period last year and 1.038 Mt in the year before.

In the first 9 months of 2024, Mexico’s cement production of the integrated plants inceased by +3.7% to 32.195 Mt, after 31.061 Mt in the same period last year and 30.375 Mt in the year before.

In the first 9 months of 2024, Chile’s cement dispatch declined by -5.4% to 3.680 Mt, after 3.891 Mt in the same period last year and 4.414 Mt in the year before.

In the first 10 months in 2024, Brazil’s cement dispatch increased by +4.3% to 54.667 Mt, after 52.394 Mt in the same period last year.