Puerto Rico’s cement sales up +7.5% in 09M 2025

In the first 9 months of 2025, Puerto Rico’s cement sales (production and imports) increased by +7.5% to 0.504 Mt, after 0.468 Mt in the same period last year and 0.478 Mt in the year before.

In the first 9 months of 2025, Puerto Rico’s cement sales (production and imports) increased by +7.5% to 0.504 Mt, after 0.468 Mt in the same period last year and 0.478 Mt in the year before.
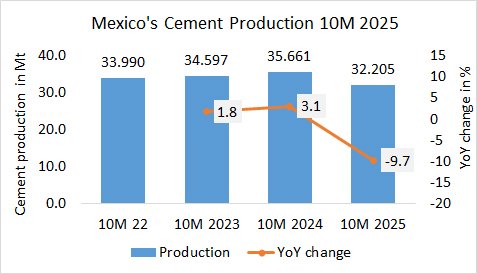
In the first 10 months in 2025, Mexico’s cement production (of integrated plants) decreased by -9.7%% to 32.205 Mt, after 35.661 Mt in the same period last year and 34.595 Mt in the year before.
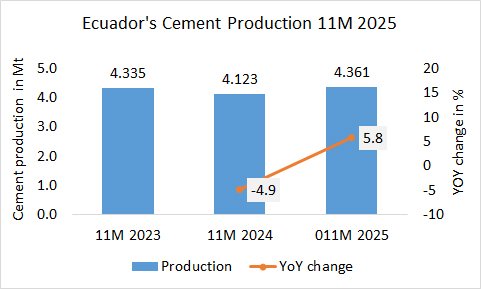
In the first 11 months in 2025, Ecuador’s cement production increased by +5.8% to 4.361 Mt, after 4.123 Mt in the last year and 4.335 Mt in the year before.
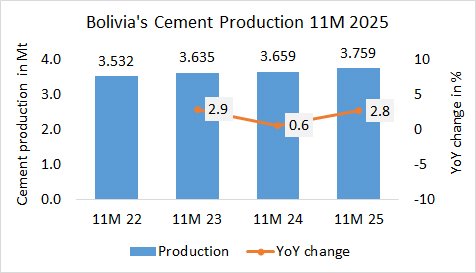
In the first 11 months in 2025, Bolivia’s cement production increased by 2.8% and 3.759 Mt, after 3.659 Mt in the last year and 3.635 Mt in the year before.
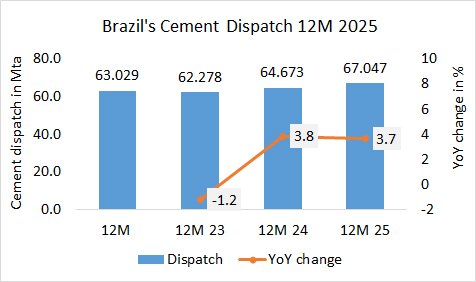
In calendar year 2025, Brazil’s cement dispatch increased by 3.7+% to 67.047 Mta, after 64.673 Mta in year 2024 and 62.278 Mta in 2023.
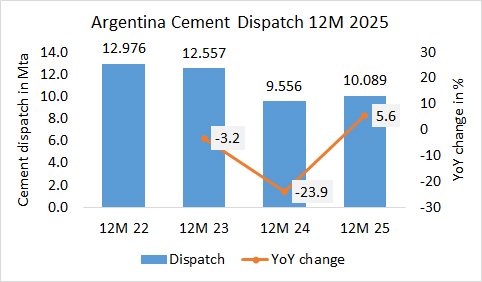
In calendar year 2025, Argentina’s cement dispatch increased by 5.6+% to 10.089 Mta, after 9.556 Mta in year 2024 and 12.557 Mta in 2023.
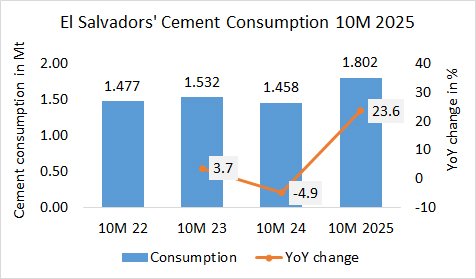
In the first 10 months in 2025, El Salvador’s cement consumption increased by +23.6% to 1.802 Mt, after 1.458 Mt in the same period last year and 1.532 Mt in the year before.
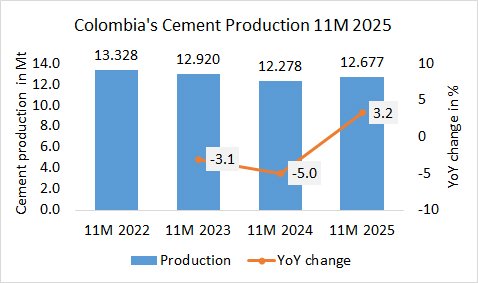
In the first 11 months in 2025, Colombia’s cement production increased by +3.2% to 12.677 Mt, after 12.278 Mt in the same period last year and 12.920 Mt in the year before.

In the first 11 months in 2025, Colombia’s cement exports declined by -12.6% to 1.023 Mt, after 1.171 Mt in the same period last year and 1.120 Mt in the year before.
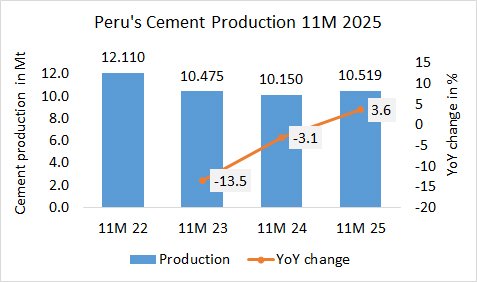
In the first 11 months in 2025, Peru’s cement production increased by +3.6% to 10.519 Mt, after 10.150 Mt in the same period last year and 10.475 Mt in the year before.