Panama’s annual cement production -9.1% in 2024
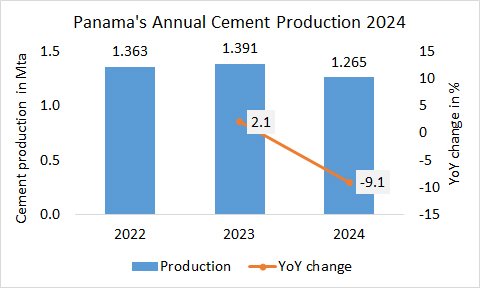
The annual cement production 2024 in Panama decreased by -9.1% to 1.265 Mta, after 1.391 Mta in the last year and 1.363 Mta in 2022.

The annual cement production 2024 in Panama decreased by -9.1% to 1.265 Mta, after 1.391 Mta in the last year and 1.363 Mta in 2022.
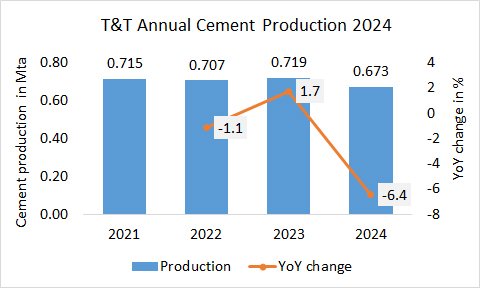
The annual cement production 2024 in T&T (Trinidad & Tobago) decreased by -6.4% to 0.673 Mta, after 0.719 Mta in the last year and 0.707 Mta in 2022.
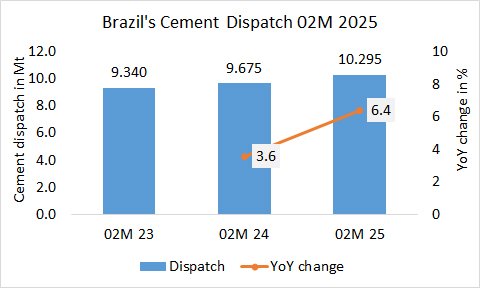
In the first 2 months of 2025, Brazil’s cement dispatch increased by +6.4% to 10.295 Mt, after 9.675 Mt same period last year and 9.340 Mt the year before.
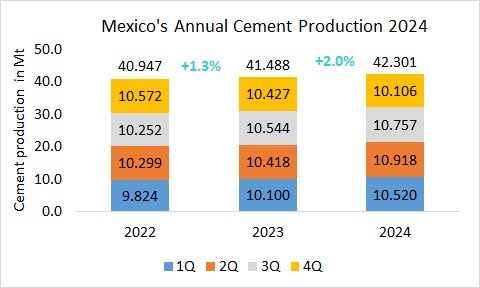
The annual cement production (of integrated plants) in Mexico increased by +2.0% to 42.301 Mta, after 41.488 Mta in the last year and 40.947 Mta in 2022.
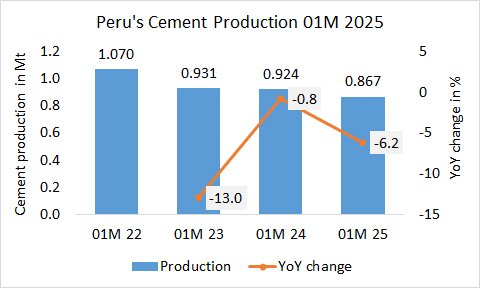
In the first month of 2025, Peru’s cement production (of the ASOCEM associated companies) decreased by -6.2% to 0.867 Mt, after 0.924 Mt same period last year and 0.931 Mt the year before.
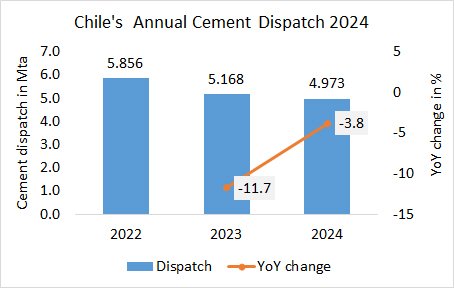
Chile’s annual cement dispatch in 2024 decreased by -3.8% to 4.973 Mta, after 5.168 Mta in the last year and 5.856 Mta in 2022
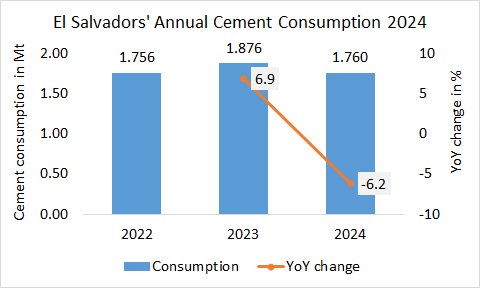
El Salvador’s annual cement consumption in 2024 decreased by -6.2% to 1.760 Mta, after 1.876 Mta in the last year and 1.756 Mta in 2022.
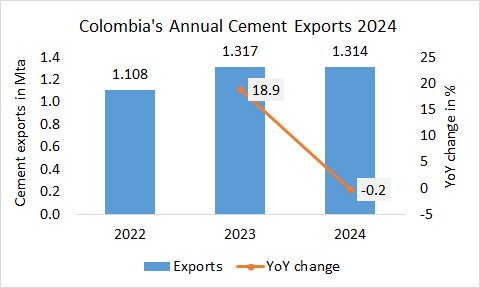
The annual cement exports by Colombia declined by -0.2% to 1.314 Mta, after 1.317 Mta in the last year and 1.108 Mta in 2022.
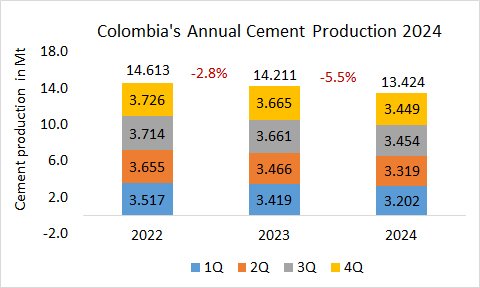
The annual cement production in Colombia declined by -5.5% to 13.424 Mta, after 14.211 Mta in the last year and 14.613 Mta in 2022.
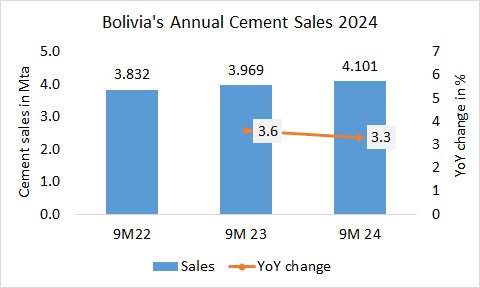
The annual cement sales in Bolivia increased by +3.3% to 4.101 Mta, after 3.969 Mta in the last year and 3.832 Mta in 2022.