Loma Negra in Argentina possibly changes ownership
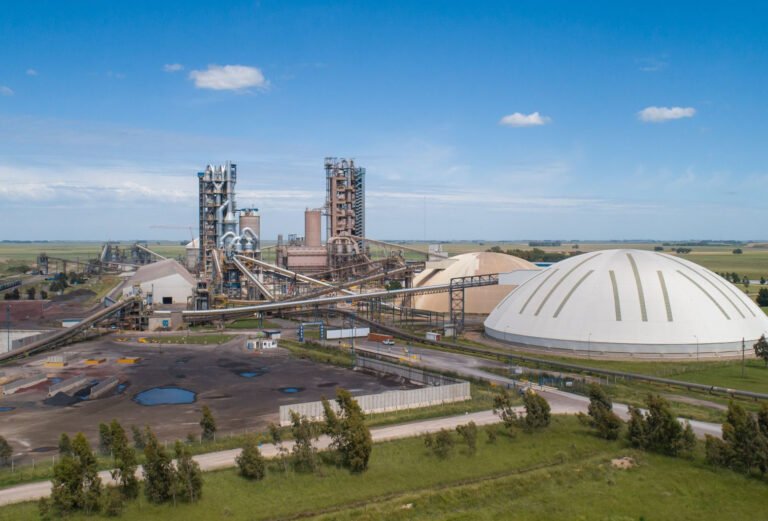
Loma Negra, Argentina’s leading cement producer, possibly changes ownership, moving from Brazilian owner InterCement (part of Camargo Corrêa) back to Argentine control under businessman Marcelo Mindlin’s investment group. The move is driven by InterCement’s debt restructuring plan, which has been…