El Salvador’s cement consumption + 21.9% in 08M 2025
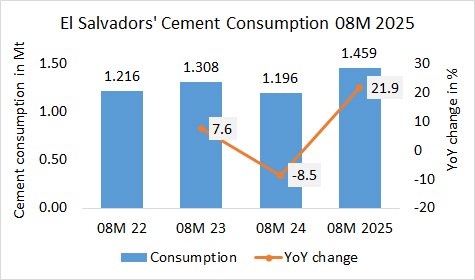
In the first 8 months in 2025, El Salvador’s cement consumption increased by +21.9% to 1.459 Mt, after 1.159 Mt in the same period last year and 1.308 Mt in the year before.

In the first 8 months in 2025, El Salvador’s cement consumption increased by +21.9% to 1.459 Mt, after 1.159 Mt in the same period last year and 1.308 Mt in the year before.
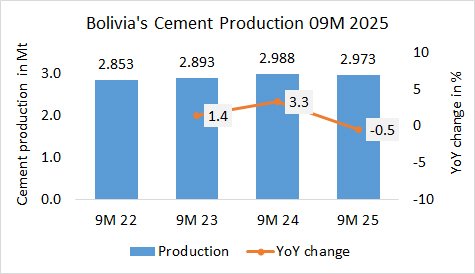
In the first 9 months in 2025, Bolivia’s cement production decreased by -0.5% to 2.973 Mt, after 2.988 Mt in the last year and 2.893 Mt in the year before.

In the first 10 months in 2025, Argentina’s cement dispatch (local and exports) increased by +7.4% to 8.490 Mt, after 7906 Mt in the same period last year and 10.715 Mt in the year before.
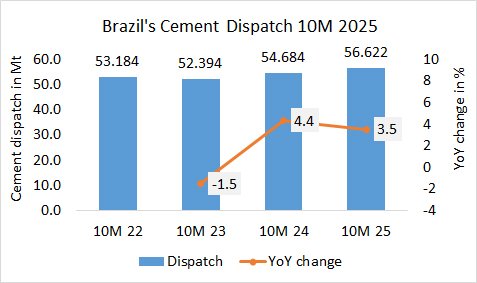
In the first 10 months in 2025, Brazil’s cement dispatch increased by +3.5% to 56.622 Mt, after 54.684 Mt in the same period last year and 52.394 Mt in the year before.
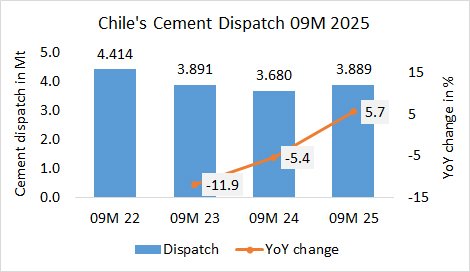
In the first 9 months in 2025, Chile’s cement dispatch increased by +5.7% to 3.889 Mt, after 3.680 Mt in the same period last year and 3.891 Mt in the year before.
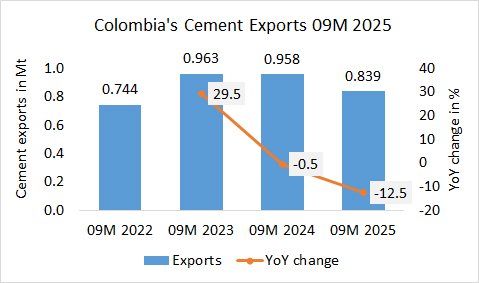
In the first 9 months in 2025, Colombia’s cement exports declined by -12.5% to 0.839 Mt, after 0.958 Mt in the same period last year and 0.963 Mt in the year before.
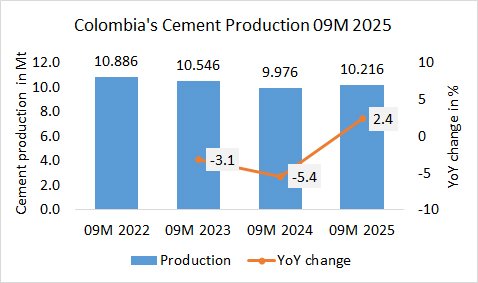
In the first 9 months in 2025, Colombia’s cement production increased by +2.4% to 10.216 Mt, after 9.976Mt in the same period last year and 10.546 Mt in the year before.
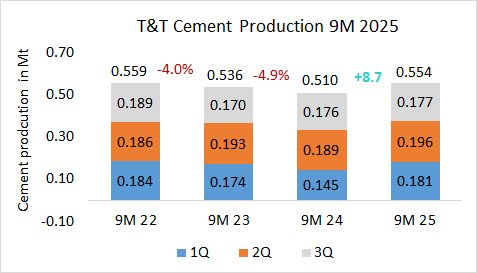
In the first 9 months in 2025, T+T’s (Trinidad + Tobago’s) cement production increased by +8.7% to 0.554 Mt, after 0.510 Mt in the same period last year and 0.536 Mt in the year before.
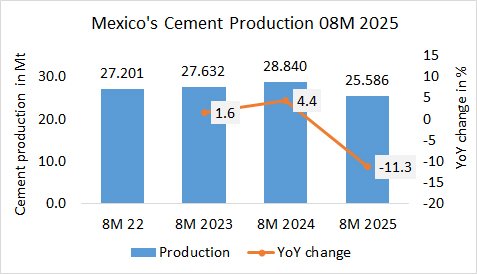
In the first 8 months in 2025, Mexico’s cement production (of integrated plants) decreased by -11.3%% to 25.586 Mt, after 28.840 Mt in the same period last year and 27.632 Mt in the year before.
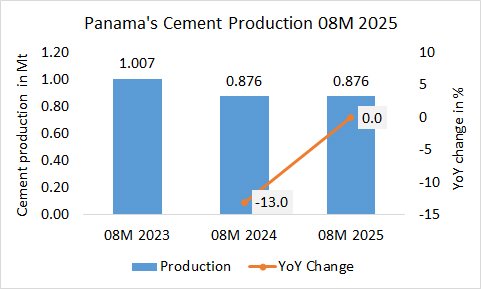
In the first 8 months in 2025, Panama’s cement production has been stable at 0.876 Mt, exactly the same amount as in the first 8 month last year, but lower than the 1.007 Mt in the year before.