Bolivia’s cement production up +0.1% in 08M 2025
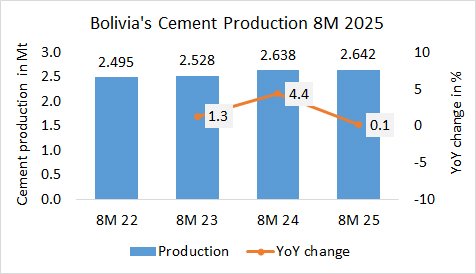
In the first 8 months in 2025, Bolivia’s cement production increased by +0.1% to 2.642 Mt, after 2.638 Mt in the last year and 2.528 Mt in the year before, despite the economic and political crisis in the country.