Chile’s cement dispatch down -1.6% in 04M 2025
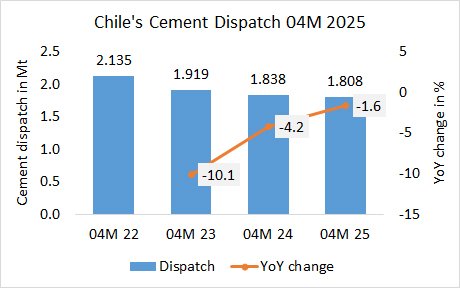
In the first 4 months in 2025, Chile’s cement dispatch declined by -1.6% to 1.808 Mt, after 1.838 Mt in the same period last year and 1.919 Mt in the year before.

In the first 4 months in 2025, Chile’s cement dispatch declined by -1.6% to 1.808 Mt, after 1.838 Mt in the same period last year and 1.919 Mt in the year before.
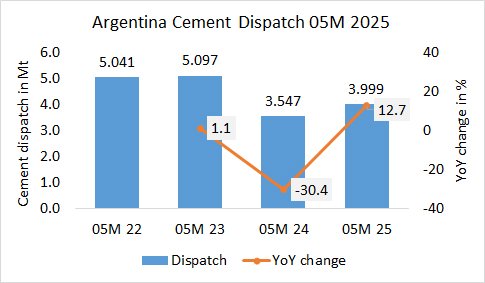
In the first 5 months in 2025, Argentina’s cement dispatch increased by +12.7% to 3.999 Mt, after 3.547 Mt in the same period last year and 5.097 Mt in the year before.
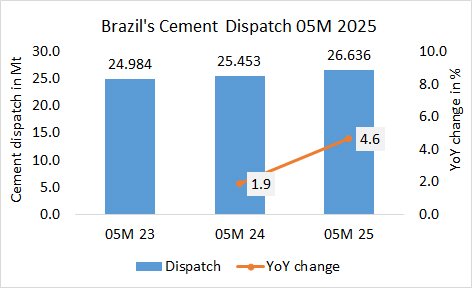
In the first 5 months in 2025, Brazil’s cement dispatch increased by +4.6% to 26.636 Mt, after 25.453 Mt in the same period last year and 24.984 Mt in the year before.
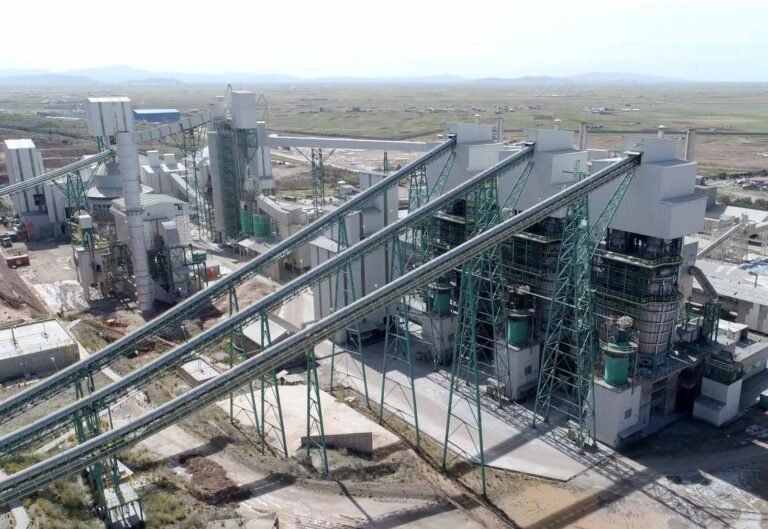
Grupo Gloria has announced a US$ 100m investment to expand its business with a lime plant in Peru, where subsidiary Cal & Cemento Sur operates already a lime plant in the high plateau region. This plant (photo) has five kilns…
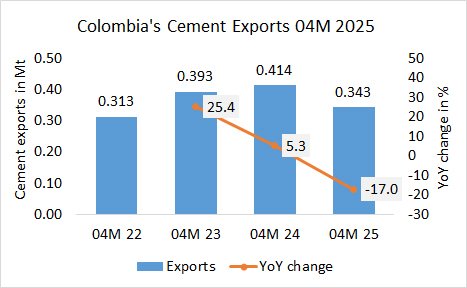
In the first 4 months in 2025, Colombia’s cement exports declined by -17.0% to 0.343 Mt, after 0.414 Mt in the same period last year and 0.393 Mt in the year before.
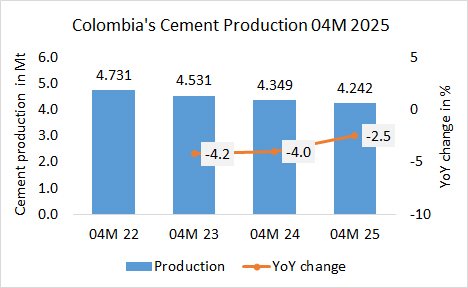
In the first 4 months in 2025, Colombia’s cement production declined by -2.5% to 4.242 Mt, after 4.349 Mt in the same period last year and 4.531 Mt in the year before.
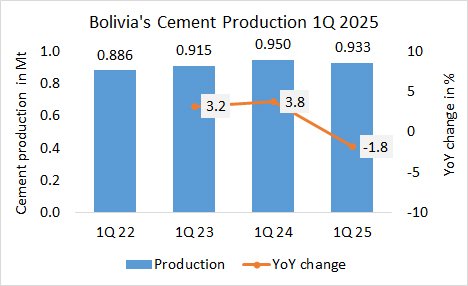
In the first quarter of 2025, Bolivia’s cement production declined by -1.8% to 0.933 Mt, after 0.950 Mt in the last year and 0.915 Mt in the year before.
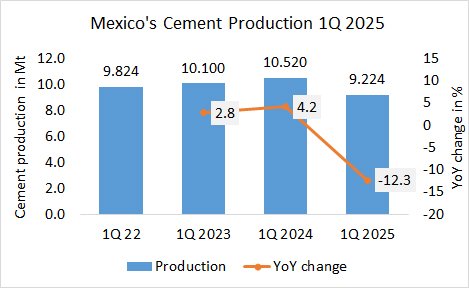
In the first quarter in 2025, Mexico’s cement production (of integrated plants) decreased by -12.3%% to 9.224 Mt, after 10.520 Mt in the same period last year and 10.100 Mt in the year before.
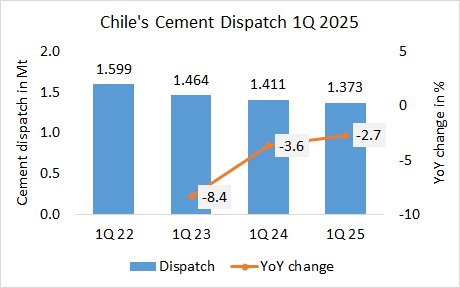
In the first quarter in 2025, Chile’s cement dispatch decreased by -2.7% to 1.373 Mt, after 1.411 Mt in the same period last year and 1.464 Mt in the year before.
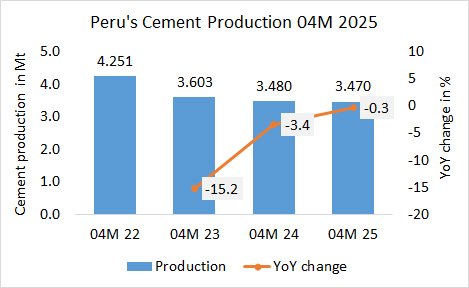
In the first 4 months in 2025, Peru’s cement production decreased by -0.3% to 3.470 Mt, after 3.480 Mt in the same period last year and 3.603 Mt in the year before.