T+T’s cement production up +12.9% in 09M 2025
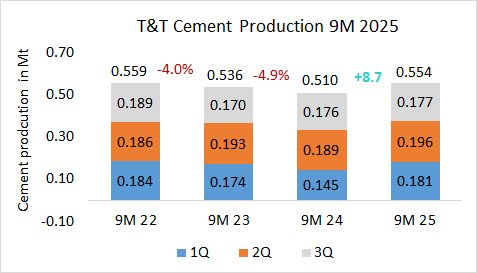
In the first 9 months in 2025, T+T’s (Trinidad + Tobago’s) cement production increased by +8.7% to 0.554 Mt, after 0.510 Mt in the same period last year and 0.536 Mt in the year before.

In the first 9 months in 2025, T+T’s (Trinidad + Tobago’s) cement production increased by +8.7% to 0.554 Mt, after 0.510 Mt in the same period last year and 0.536 Mt in the year before.
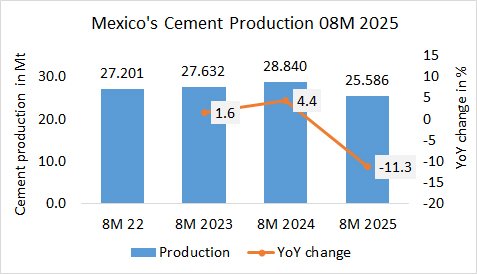
In the first 8 months in 2025, Mexico’s cement production (of integrated plants) decreased by -11.3%% to 25.586 Mt, after 28.840 Mt in the same period last year and 27.632 Mt in the year before.
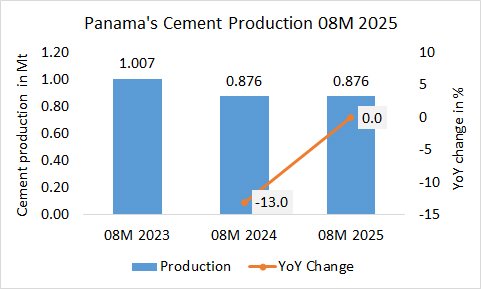
In the first 8 months in 2025, Panama’s cement production has been stable at 0.876 Mt, exactly the same amount as in the first 8 month last year, but lower than the 1.007 Mt in the year before.
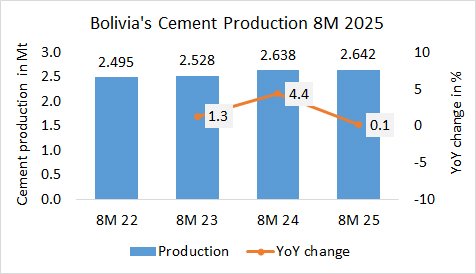
In the first 8 months in 2025, Bolivia’s cement production increased by +0.1% to 2.642 Mt, after 2.638 Mt in the last year and 2.528 Mt in the year before, despite the economic and political crisis in the country.
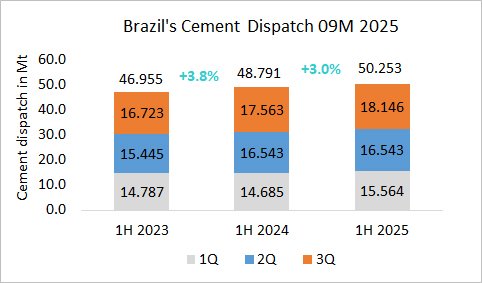
In the first 9 months in 2025, Brazil’s cement dispatch increased by +3.0% to 50.253 Mt, after 48.791 Mt in the same period last year and 46.955 Mt in the year before.
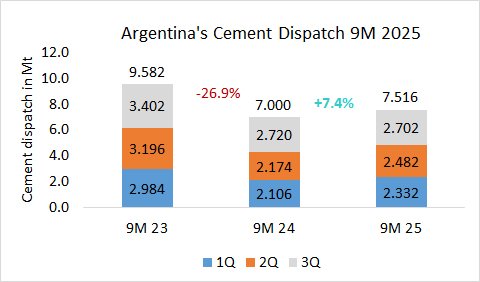
In the first 9 months in 2025, Argentina’s cement dispatch (local and exports) increased by +7.4% to 7.516 Mt, after 7.000 Mt in the same period last year and 9.582 Mt in the year before.
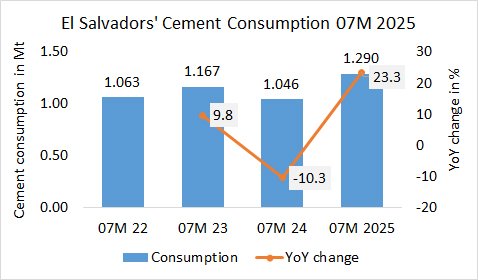
In the first 7 months in 2025, El Salvador’s cement consumption increased by +23.3% to 1.290 Mt, after 1.046 Mt in the same period last year and 1.167 Mt in the year before.
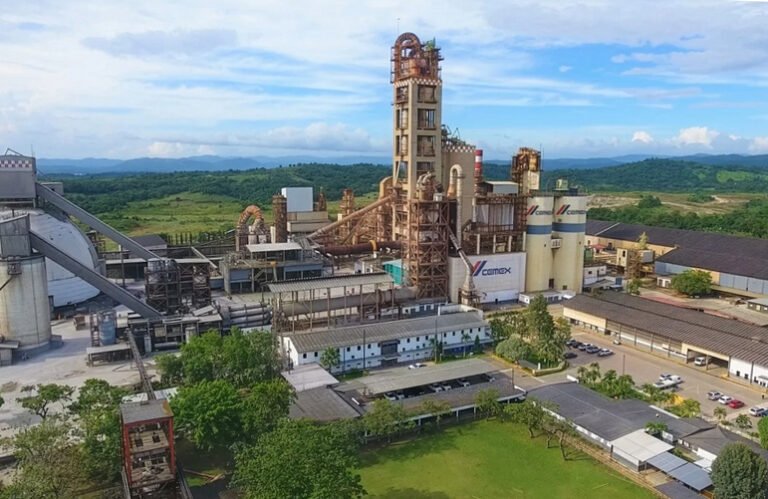
Grupo Estrella announced the purchase of the assets of Cemex Panama with an investment of more than US$ 200m. The acquisition in Panama includes the the BAYANO cement plant (photo) with two integrated production lines, as well as all its…
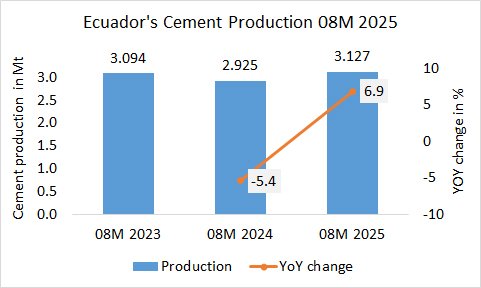
In the first 8 months in 2025, Ecuador’s cement production increased by +6.9% to 3.127 Mt, after 2.925 Mt in the last year and 3.094 Mt in the year before.
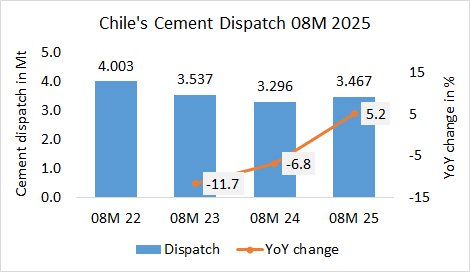
In the first 8 months in 2025, Chile’s cement dispatch increased by +5.2% to 3.467 Mt, after 3.296 Mt in the same period last year and 3.537 Mt in the year before.